Real-Time Monitoring Across Your Power Systems Servers
Avoiding downtime and taking full control of your Power Systems server requires a central view of system performance and a proactive approach to performance threats. Robot Monitor allows you to monitor and investigate issues on your IBM i and AIX operating systems, so you can resolve issues before they escalate and plan for future needs by tracking and analyzing past performance trends.
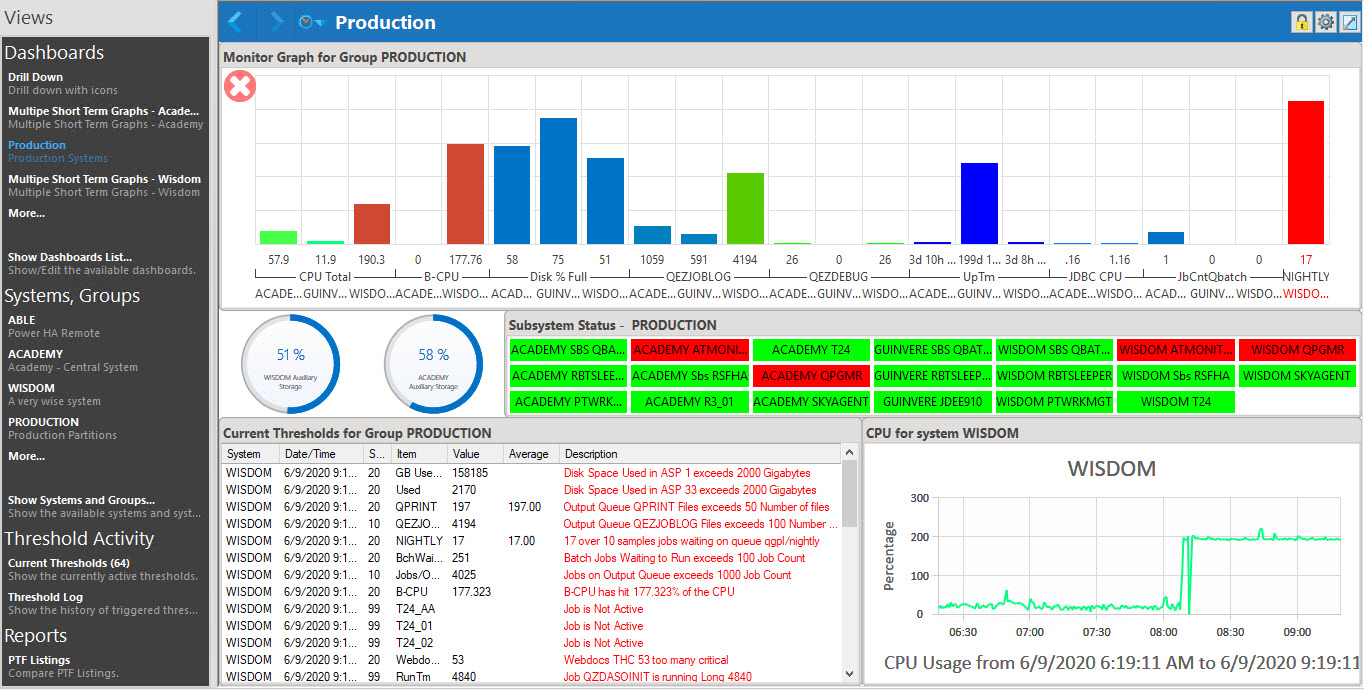
Dashboards and Drilldown Analysis
Robot Monitor includes a fully graphical console with dashboards that can be individually tailored to display what’s important to your unique needs. You can view any combination of real-time, historical, and summary information for system and application elements and reduce the time it takes to pinpoint issues that lead your systems astray by drilling down to discover the root cause in virtually no time. Plus, you can set multiple thresholds for any metric to trigger notifications via Robot Alert, Robot Network, message queues, or SNMP traps.
VIOS Monitoring
Today’s Power Systems are much more flexible than in the past—it’s simple to move resources from one LPAR to another. But any change may affect the behavior of the system. Robot Monitor can help by measuring the performance in detail every time. In fact, more Power partitions are relying on the Virtual I/O Server (VIOS) to allocate storage and network resources, so you can maintain optimal performance and flexibility for the virtual environment. However, since VIOS is a superset of AIX, IBM i teams often have no way to anticipate VIOS issues without asking the AIX/UNIX team—until now. Robot Monitor provides visibility into the metrics that indicate VIOS health, including network, processor, memory, disk, error log (ERRPT), and much more. Now you can monitor your IBM i and VIOS partitions from one spot!
Application Monitoring
To gauge the availability and performance of your applications running on Power Systems servers, Robot Monitor provides built-in monitors for jobs, memory, disk, CPU, devices, files, queues, response time, spooled files, temporary storage, communications, and much more. An IBM i-centric tool, Robot Monitor also allows you to take advantage of the substantial database integrations built into the IBM i platform by using an SQL interface to create custom monitors for virtually any value on IBM i.
Robot Monitor also comes equipped with built-in monitors for business-critical applications, including Backup, Recovery, and Media Services for IBM i (BRMS), IBM MQ middleware, and data replication tools like Robot HA, PowerHA, or MIMIX.
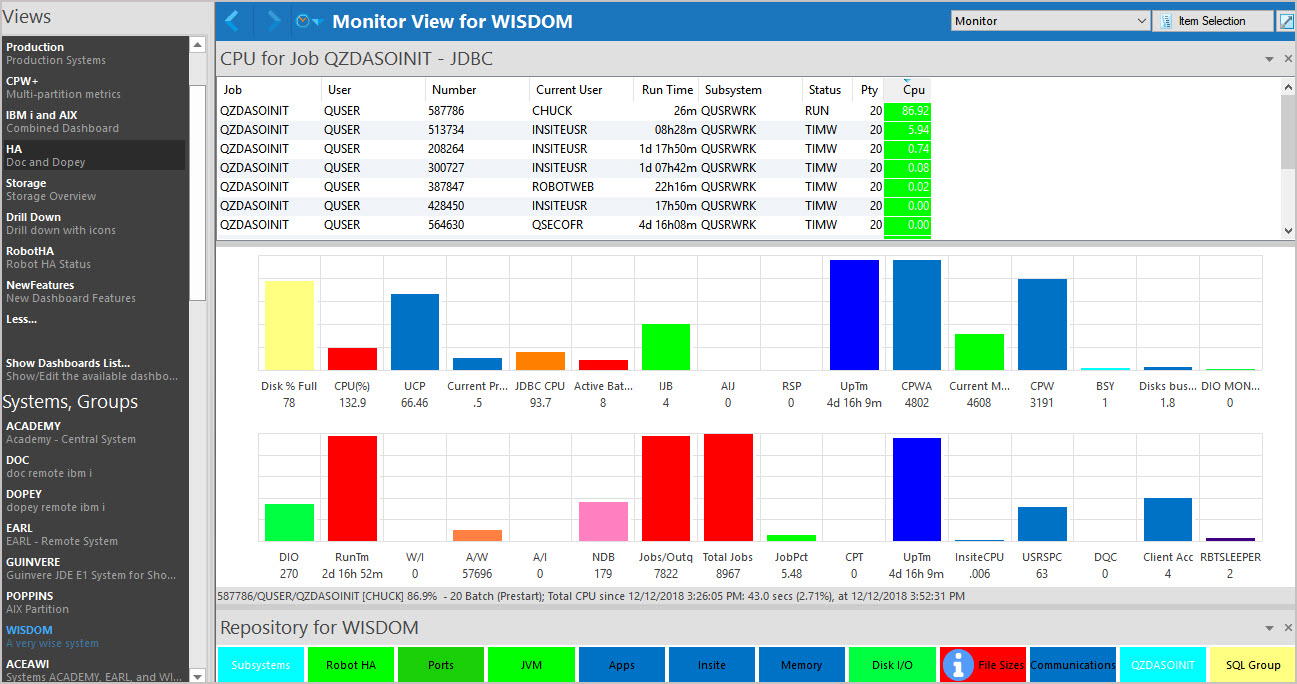
Job Monitoring
Robot Monitor gives you control over problem jobs as they occur with real-time alerts, escalations, and commands. With centralized, proactive control for jobs running in your Power Systems network, you can ensure that jobs are running correctly by keeping a watchful eye on various job components, creating user-definable thresholds, and being informed of job status changes or irregular run times. Drill down to see the top consumers of CPU, SQL, and disk I/O on the system, work with the job, and even see the exact SQL statement that is causing the spike to occur—especially important for QZDASOINIT ODBC/JDBC activity.
Disk Monitoring
Robot Monitor allows you to proactively monitor the main offenders of disk usage, including QTEMP, temporary storage, spooled files, journal receivers, any collection of objects on your system, and auxiliary storage pools or independent ASPs (IASP).
With graphical access to this information at your fingertips, you can easily pinpoint the cause and location of sudden increases in disk usage, identify the largest library and objects in real time, conduct analysis by library, directory, attribute, or last-used date, and review data across periods to analyze any disk growth trends that may be occurring.
Reporting and Forecasting
With customized, graphical reports for retrospective analysis and predictive forecasting, Robot Monitor makes report management simple in all areas, including service-level agreements, audit purposes, and trend analysis. Easy-to-schedule, automated reports save you time and resources. Plus, you can send reports directly to a list of recipients via email or direct them into a network directory.
Get Started
Seeing Robot Monitor in action will help you determine how proactive performance monitoring can save you time and money. Request your demo today.