One of the best things about Sequel is that you can easily use it with Microsoft Excel in so many ways—and business users love Excel.
Now, you can Excel even more with Sequel.
Here’s every possible way that you can use Sequel with Excel:
- Use Excel as a Data Source
- Access Data in Excel Itself
- View Data Results in Excel
- Deliver Data Results to Users in Excel
Not using Sequel yet? Watch the webinar to learn more about Sequel's integration with Excel.
1. Use Excel as a Data Source
Have data in an Excel spreadsheet that you’d like to access in Sequel? Now you can (as long as you have Sequel 11.3 or higher).
Here’s how to add an Excel spreadsheet in Sequel Viewpoint—without doing a manual upload:
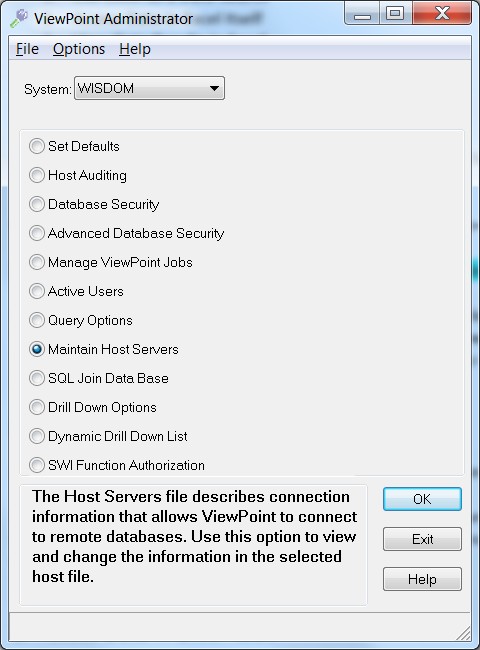
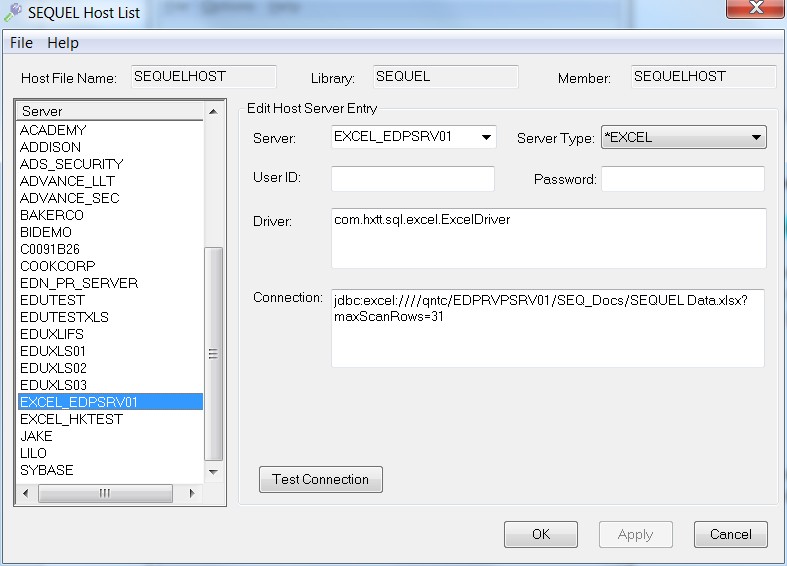
First you will need to create a connection to Excel through Viewpoint Administrator. To open Viewpoint Administrator, click “Tools” and then select Viewpoint Administrator. Click “Maintain Host Servers.” See the appendix of the Viewpoint User Guide for additional information on setting up remote connections.
Need help setting up your connection? Ask Fortra Professional Services >
Once your connection is set up, go into View Designer. Select “File” to “Properties,” and then choose the Excel connection that you just created.
Next, select and run your file. That Excel data is now in your Sequel view.
Now that your Excel information is in Sequel, you can add functionality: summarize to dynamically drill down into the details, slice and dice it in a client table, and pull it into a graph on a Sequel dashboard. You can even push it back to Excel when you’re done working with it in Sequel Viewpoint.
2. Access Data in Excel Itself
The Excel Plug-In (Excel 2010) gives Sequel users the option to access their Sequel views from Viewpoint directly in Excel. You can take advantage of Excel features (like graphs) and use them over your live data.
Here’s how to get started:
The Viewpoint toolbar is where you’ll do everything you need to do with your Sequel data.
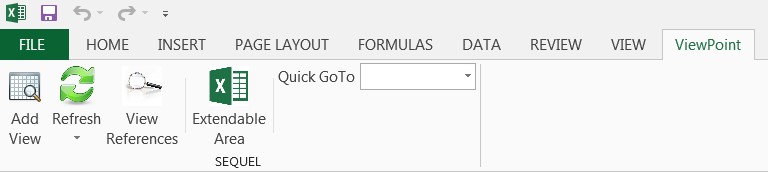
First, you’ll need to add your view—so click “Add View.”
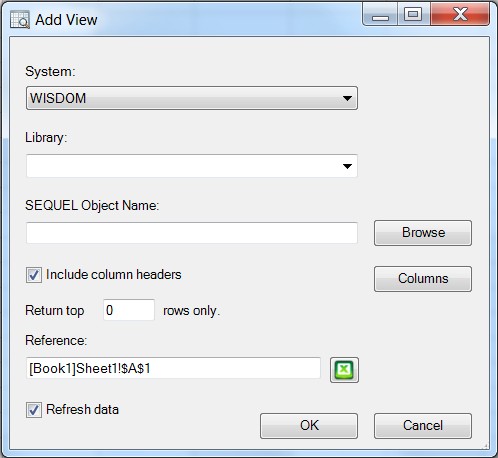
Here’s a cheat sheet to help you add your view for the first time:
- Select System, Library, and Sequel Object Name to run the desired view
- Select “Include column headers” to make the column names viewable
- Click “Columns” to select specific columns to be included
- Return top n rows to limit how many data items are shown
- Click “Reference” to determine which tab of the spreadsheet the view will run on
- Select “Refresh data” to automatically receive live data each time the Excel file is opened
If you forget to select “Refresh data” when you add a view, you can always click on “Refresh” in the Viewpoint toolbar to manually refresh the data.
You can even add multiple views (or other Sequel objects) to the same spreadsheet.
Not sure which views you’ve already added? No problem. Here’s how to find out which ones you’ve added—and modify them if you need to.
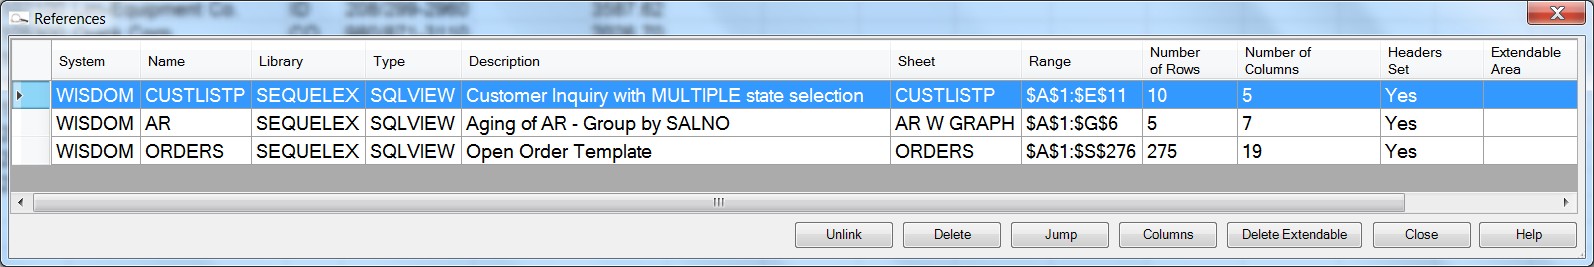
Click “View References” to display the list of views that you have added. You can even make modifications if you need to. Need the data to stop refresh? Click “Unlink.” Or if you don’t want a view to be in the spreadsheet anymore, you can click “Delete”.
Want to take full advantage of accessing your Sequel data in Excel? Then the “Extendable Area” is your next step. It allows you to work with an additional column (i.e. for performing calculations).
Let’s say that you’re looking at an existing view in your spreadsheet. This view shows you the Current Balance Due for the customers shown. But you also want to know the percentage of the Total Amount Due that each customer owes. By utilizing an Extendable Area, you can perform this calculation—and ensure that it updates each time your data refreshes.
Here’s how:
First, sum up the Total Amount Due in the Current Balance Due column. Then, enter a formula in the next column that determines the percentage total for each row of data.
Next, define the new percentage column as an Extendable Area:
- Click “Extendable Area” in the toolbar.
- When the “Range Selection” window appears, click and drag the tool to highlight the desired area (the gray column above) and press OK.
- A window with a list of views currently in your workbook appears. Select the view that you want to associate with the Extendable Area (the one on which you’ve just placed your Extendable Area).
Now that you’ve finished setting up your Extendable Area, you can also highlight it to make it more distinguishable.
3. View Data in Excel
Whether you’re in Sequel Viewpoint or Sequel Web Interface (SWI), it’s easy to view your data in Excel.
Here are a few ways to view your data in Excel:
a. Display Results in Excel
Ready to view your Sequel data results in Excel? All you need to do is right-click on your Sequel object and click “Display Results in Excel.” Your results will then display in Excel. No further effort necessary.
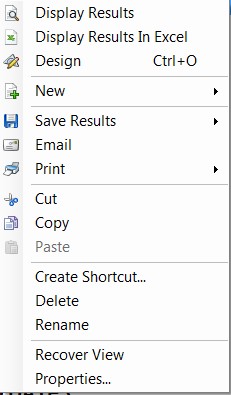
You can also go up to “File” and click “Display Results in Excel” from there. Either way, displaying results in Excel is quick and easy.
b. Save in Excel
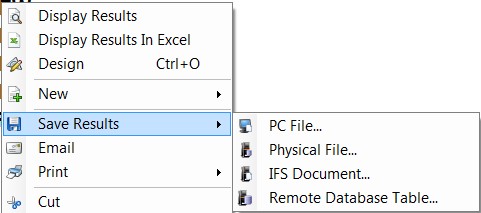
Done working with your Sequel data? Save it in Excel for future reference. Simply right-click on that Sequel object again and select “Save Results.” Choose “PC File” from the listing, and then select Microsoft Excel in the drop-down window. Decide where you want that file to be saved. Now your Sequel results are waiting for you whenever you want to return to them.
c. Download to Excel
You can directly download your results to Excel as well. From Viewpoint, you can click on “File,” then select “Export to Excel.” Your results will automatically download in an Excel file. This method will retain your Viewpoint format.

If you’re building a Sequel dashboard, you can add an action button to download to Excel. Users can click the button and the data behind the dashboard will promptly download in an Excel file.
4. Deliver Data in Excel
You now have the data that your business users want. Next: you need to deliver it the way they want it. And the way they want it is most likely in Excel.
Here are a few ways to deliver data to users in Excel:
a. Email an Excel attachment
Right-click on your Sequel object again, but this time, select “Email.” Enter your recipient and choose an Excel file in the drop-down menu and click “OK.” Presto: you’ve just delivered the results to users in Excel.
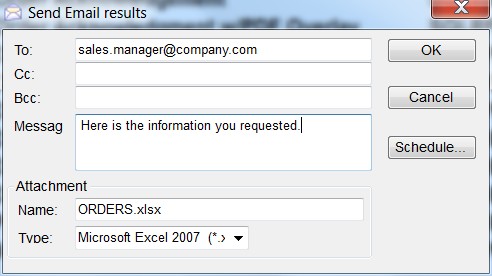
You can also schedule the results to deliver in an email on your timeline. Do exactly what you just did: Right-click on your Sequel object again and select “Email.” Enter your recipient and choose an Excel file in the drop-down menu. BUT this time you will click “Schedule” instead of “OK” and choose the date and time you would like the attachment to be delivered.
Need a faster way to email an Excel attachment? Create a shortcut by right-clicking your Sequel object, choosing “Create shortcut” to send an email with an Excel attachment.
b. Send the Excel file to a shared folder
You can also send the Excel file to a shared folder on your server for users to access. Right-click on the Sequel object, click “Save Results” and then select “IFS Document” to save it to the server. You can also click “Remote Database Table” instead to send results to a remote server.
Summary
Now you are ready to Excel with Sequel in every possible way! For more information on using Sequel with Excel, contact your support team.
Get help using Sequel with Excel.
Your support team is ready and waiting to help you with your Sequel request.