As Power Systems servers become more consolidated, your IBM i team needs better visibility into their virtualized environment, whether it’s on-premises or in the cloud. A single Power server can support IBM i, AIX, Linux, and Virtual I/O Server (VIOS) partitions, so elements outside your IBM i operating system can—and do—impact IBM i system and application performance.
In addition to hundreds of IBM i metrics, Robot Monitor allows you to proactively monitor the key metrics that impact VIOS and address issues before partition performance suffers—all without being an AIX expert, asking the AIX team, or paying an AIX contractor.
If you’re new to Robot Monitor, you can learn more about its AIX/VIOS monitoring functionality by watching this webinar. In summary, Robot Monitor collects performance and status information from each AIX, VIOS, and IBM i partition every 30 seconds, displays this information in real time, and stores this data for historical detail and summary analysis. The summary analysis is especially important. It helps when setting thresholds for metrics that you’re less familiar with and as you learn what an unusual measurement might look like.
If you already own Robot Monitor or are keen to dig into the technical nitty gritty, here’s a quick lesson on how to set up AIX/VIOS monitoring in Robot Monitor and our recommendations for initial thresholds.
Step 1: Install the AIX/VIOS agent on your VIOS partition(s).
Ultimately, the installation of the AIX agent software is accomplished using the RPM command:
rpm -ihv http://{host}:3070/rbtmonsmcd.rpm
Please review the AIX/VIOS installation instructions located here in our self-service knowledge base.
The background collector program or "daemon” in UNIX terms, rbtmonsmcd, is installed as a subsystem in AIX and VIOS. Startup and shutdown scripts are installed for runlevel 2.
Step 2: Review the automatically configured AIX/VIOS metrics.
The default, built-in monitoring metrics for AIX/VIOS will be collected automatically and displayed in the principal group for that system. You’ll find a list of the collected metrics by clicking on “Item Selection” at the top right. You can also create a new monitoring metric by clicking “Monitor something new”, as shown in Figure 1.
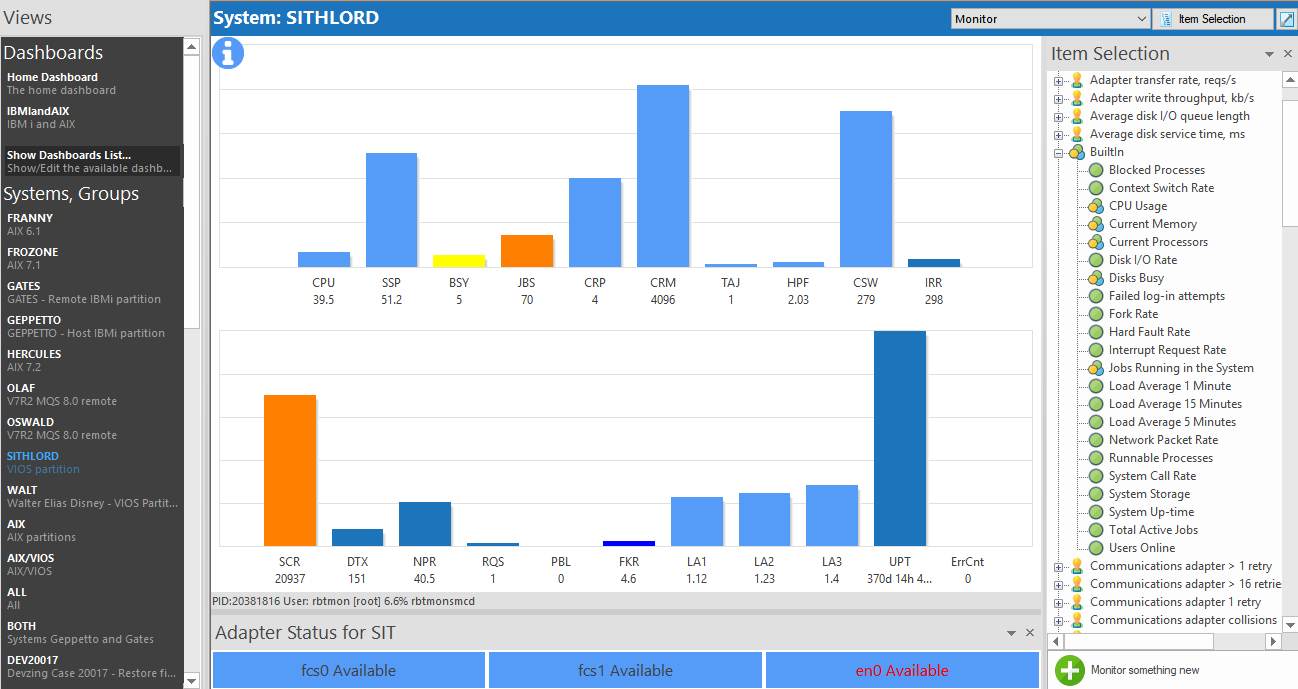
Figure 1: Built-in AIX/VIOS metrics
Step 3: Review the threshold for CPU utilization.
Right-click on the built-in CPU usage metric and select “Properties” to set up the monitor and adjust the threshold settings. Not all metrics will have pre-defined thresholds. You can determine those thresholds later after you’ve collected and reviewed history for each metric.
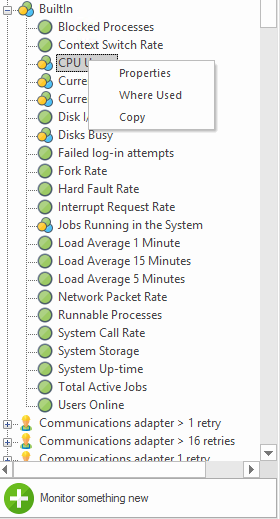
Figure 2: Edit the monitor properties for CPU utilization
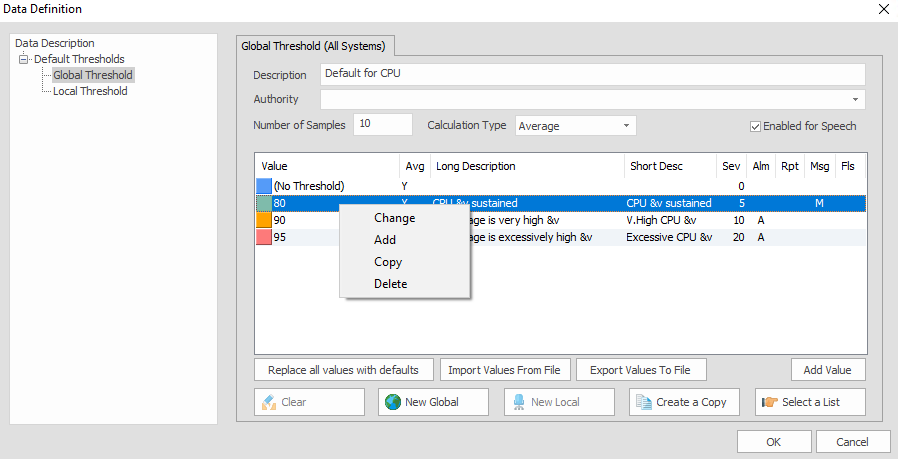
Figure 3: Verify 80% sustained threshold over 10 samples averaged
You can determine your escalation option for when a threshold is exceeded. You can send a message into the Robot Monitor message queue, use Robot Network to send a message to the Status Center, or use Robot Alert to send you an SMS text or email notification. You will need to log in to the GUI to work with thresholds.
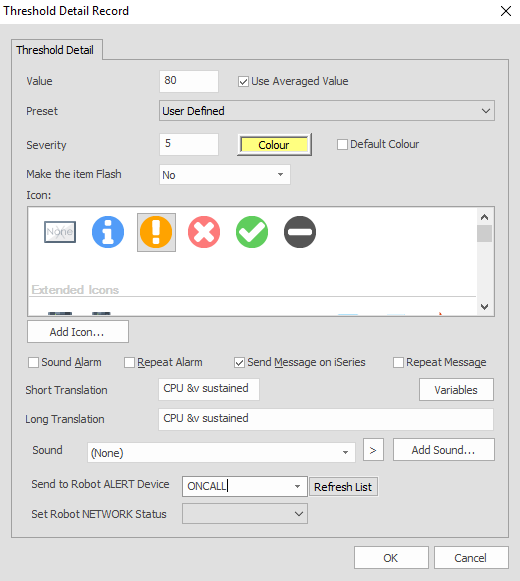
Figure 4: Configure your choice of threshold escalation
We used CPU in this example, but you can set thresholds for other metrics as well. Our recommendation for the built-in CPU utilization is not to exceed 80% sustained (10 samples, averaged).
Additionally, we’d recommend that the System Storage metric not exceed 80%. (Note: This is the equivalent of “AUX – Auxiliary Storage” for an IBM i partition.)
Step 4: Configure AIX/VIOS error report monitoring.
The AIX/VIOS error report identifies hardware, software, operator, and categorically unknown issues that might need your attention. Instead of calling the error report command repeatedly to find different pieces of data, Robot Monitor automatically aggregates this data for you and offers one-click drilldown into the details, making it easy to view and interpret the data.
A count of the total errors can easily be created in the primary vertical bar graph display or in a dashboard. In the Monitor view, click “Item Selection” and then “Monitor something new”.
In the upper, right-hand corner, find and select the filter for “Vios elements”. Then choose the “Error Report Count” monitor type at the top of the middle section. Initially, you’ll want to configure this to monitor all possible error report entries, as shown in Figure 5:
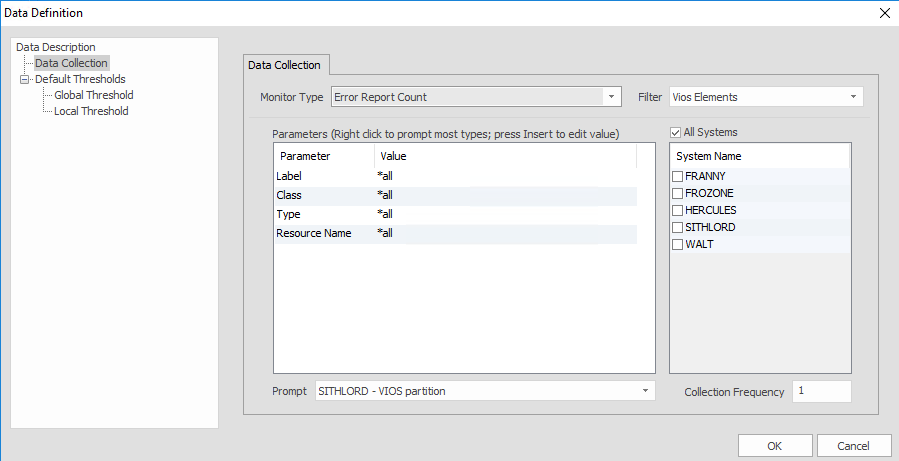
Figure 5: Error Report Count monitor configuration
Our recommendations for the Error Report Count is to be notified on one or more errors. You can set this up from the left-hand column, under “Global Thresholds”. Your initial configuration should alert you to an error count greater than zero, as shown in Figure 6, and you choose your preferred method for notification.
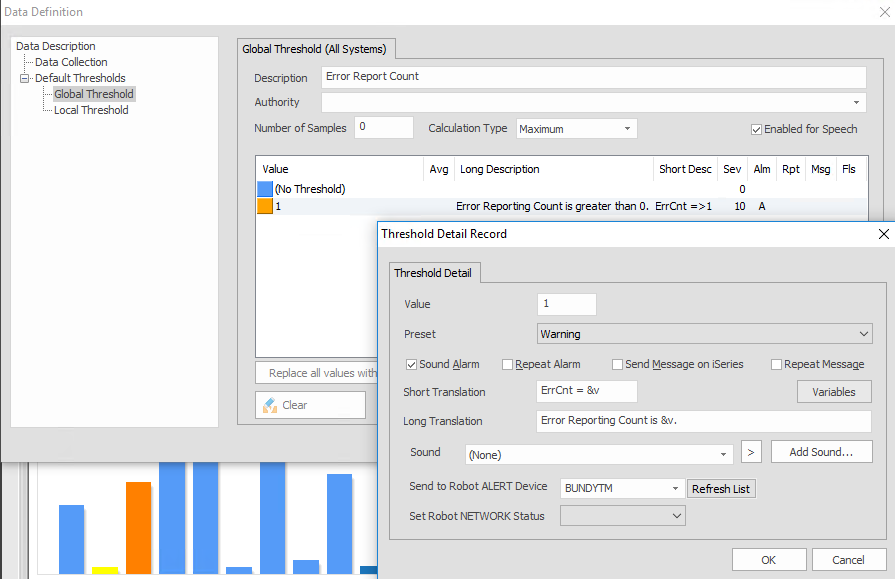
Figure 6: Configure a threshold value of 1 or greater
Figure 7 shows how, when errors do appear, you have the ability to drill down to the details.
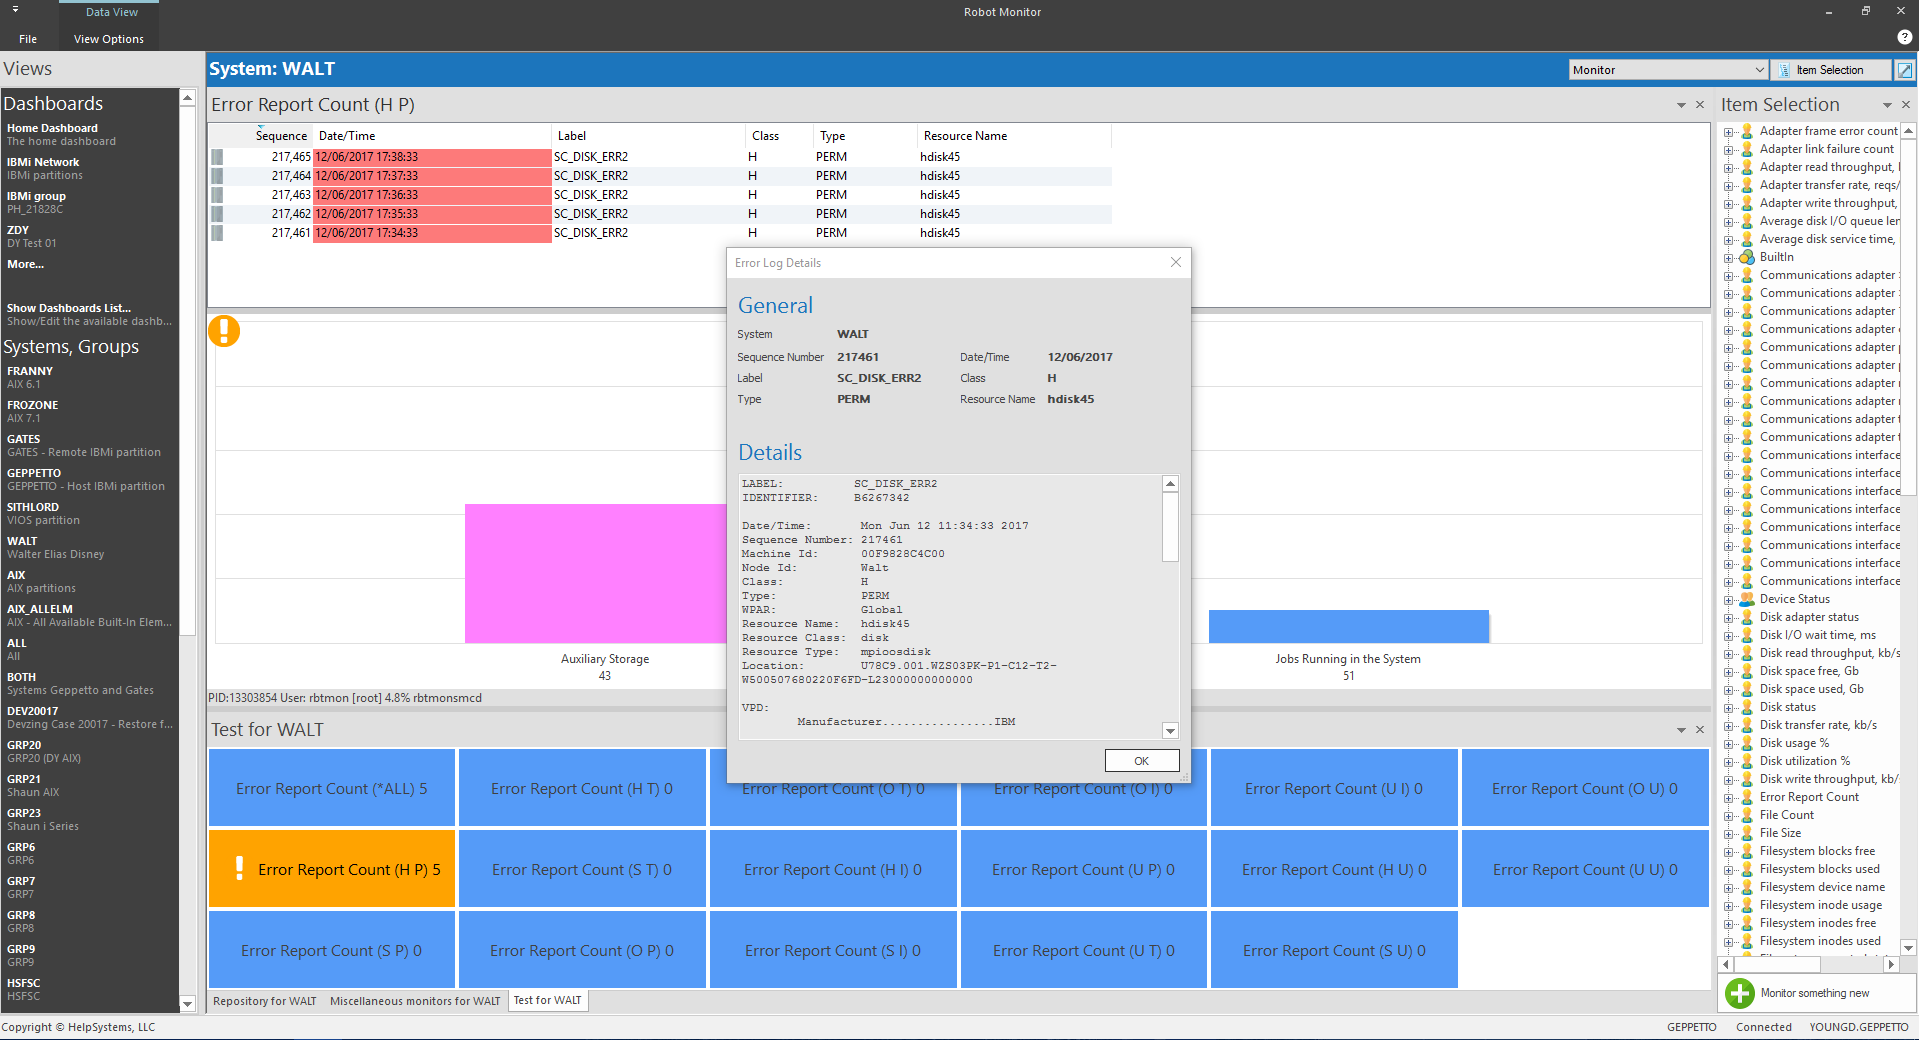
Figure 7: Drill down to the details of th error report log
Step 5: Configure AIX/VIOS memory monitoring.
AIX and VIOS memory usage is different from the single-level storage architecture on IBM i. There is a defined amount of space for both program utilization and "swap" or paging space.
To set up memory monitoring in VIOS, first click “Item Selection” in the Monitor view, then “Monitor something new”.
In the upper, right-hand corner, find and select the filter for “Vios elements”. Then choose the “Swap Space Usage” monitor type at the top of the middle section.
We recommend a swap space usage threshold of no more than 70% utilization, as shown in Figure 8.
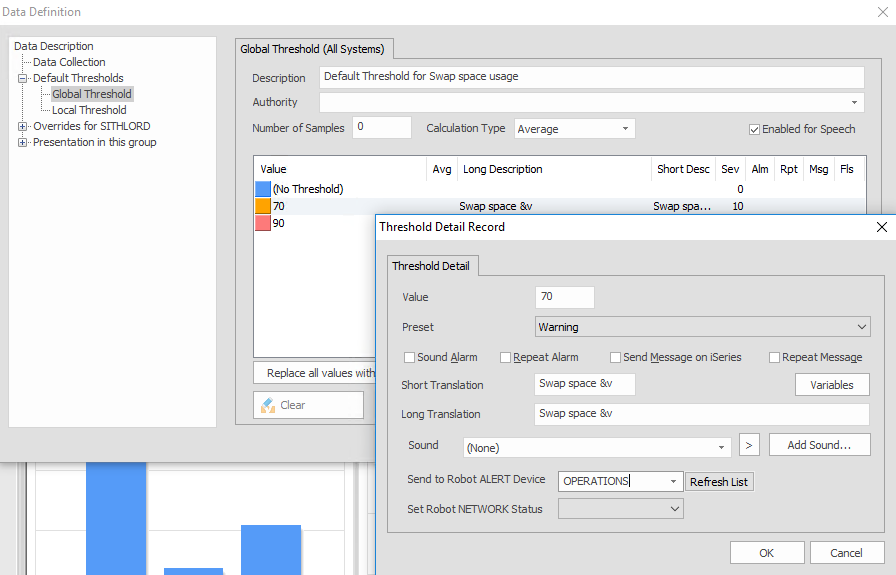
Figure 8: Configure swap space usage and verify a 70% threshold is defined
Then choose “Monitor something new” again. In the upper, right-hand corner, find and select the filter for “Vios elements”. Then choose the “Real Memory Usage” monitor type at the top of the middle section.
We recommend a real memory usage threshold of no more than 90%.
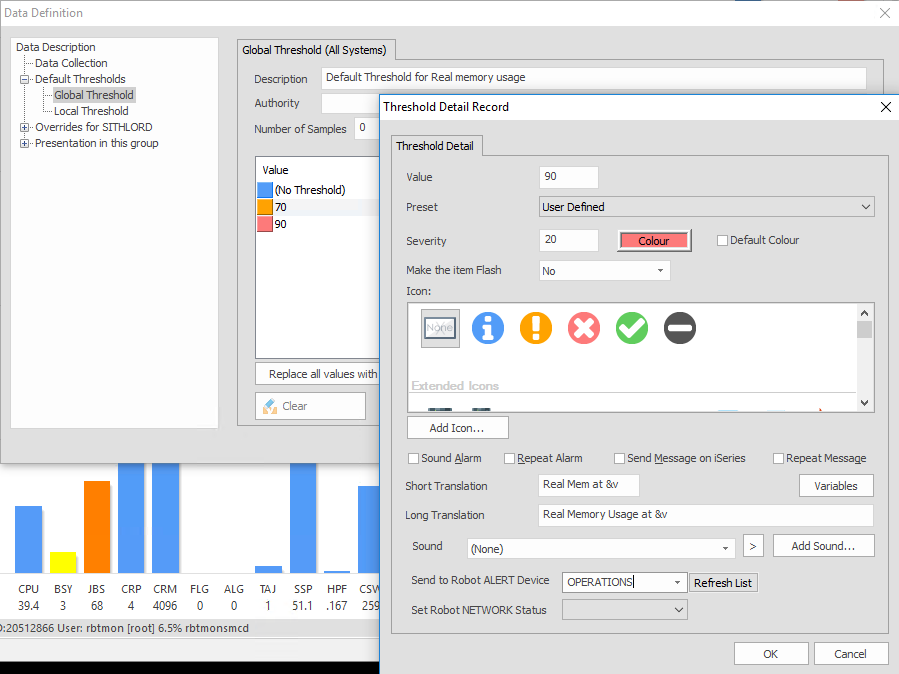
Figure 9: Configure real memory usage and verify a 90% threshold is defined
Step 6: Configure disk adapter and network interface status monitors.
Hardware adapter cards for disk and the network interface are critical to the function of your VIOS partition. In the same way as above, we recommend setting up two additional monitors for these areas:
- Disk adapter status
- Network interface status
These monitors will indicate a text status of “Available” or “Stopped” so they should be placed in a “text” type group and appropriate escalation should be put into place.
Finally, we recommend that you add all of the monitors you just set up for VIOS to the GUI display for the VIOS system and/or add them to a Robot Monitor dashboard.
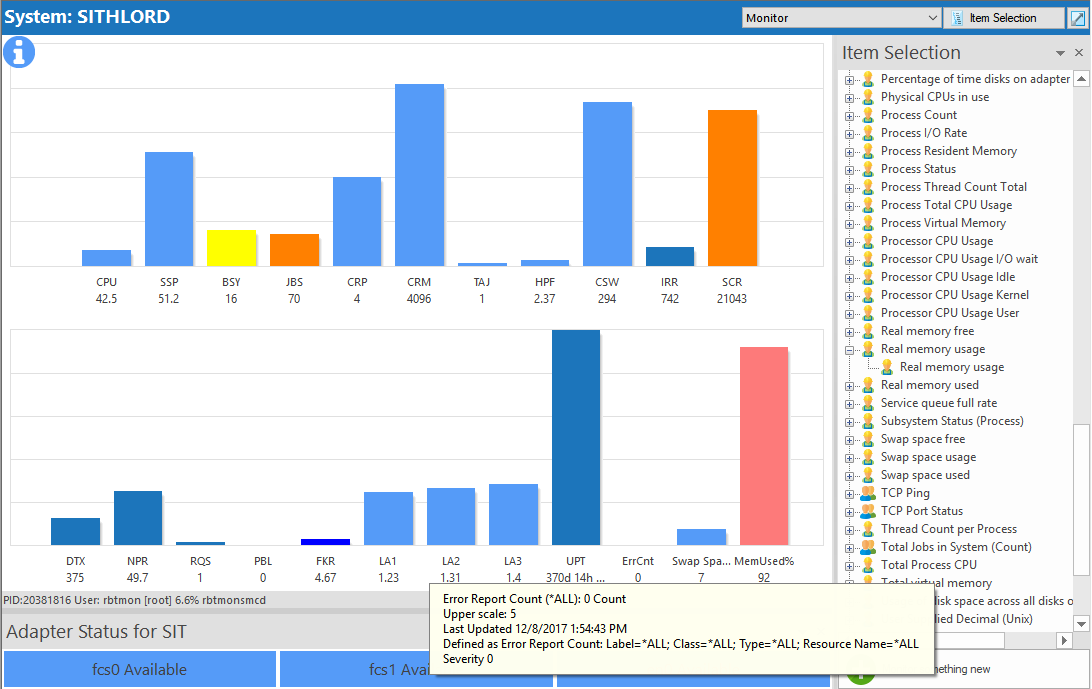
Figure 10: Metrics for VIOS error log, swap space, and real memory utilization added to a graph
Summary
Now, take a step a back and look at what you’ve put in place to continuously and automatically monitor your VIOS virtual environment. You’ll receive instant notification via your preferred method if any of the following conditions occur:
- CPU utilization above 80% sustained (10 samples, averaged)
- System storage above 80%
- Error count greater than 0
- Swap space usage above 70%
- Real memory usage above 90%
- Disk adapter enters status “Stopped”
- Network Interface enters status “Stopped”
Using Robot Monitor to monitor your AIX/VIOS partitions in addition to your IBM i environment will help you keep your virtualized Power server environment happy and healthy.
Get Started
Learn how Robot Monitor helps you take a proactive approach to system threats by identifying potential problems before they impact performance and productivity. Request a free demo today.
