With the correct performance monitoring solution in place, my tried and trusted three-step process for successful performance management is still very relevant and can be used extensively as the underpinning discipline that helps make the modern approach to performance management so straightforward.
Combining this three-step process with modern performance monitoring tools, like Halcyon’s Network Server Suite or monitoring suites for IBM i, as well as a service level reporting tool such as Advanced Reporting Suite, creates a successful strategy for performance management that will become a valuable cornerstone in your IT department and your organization.
Step 1: Monitoring and Alerting
Pre-Configured Templates
Make use of solutions that have pre-configured templates to get up and running with your monitoring quickly (and without having to write scripts). By choosing the right tool, you can monitor the core system components (CPU, disk, and memory) in addition to hundreds more to provide you with ultimate peace of mind, day and night.
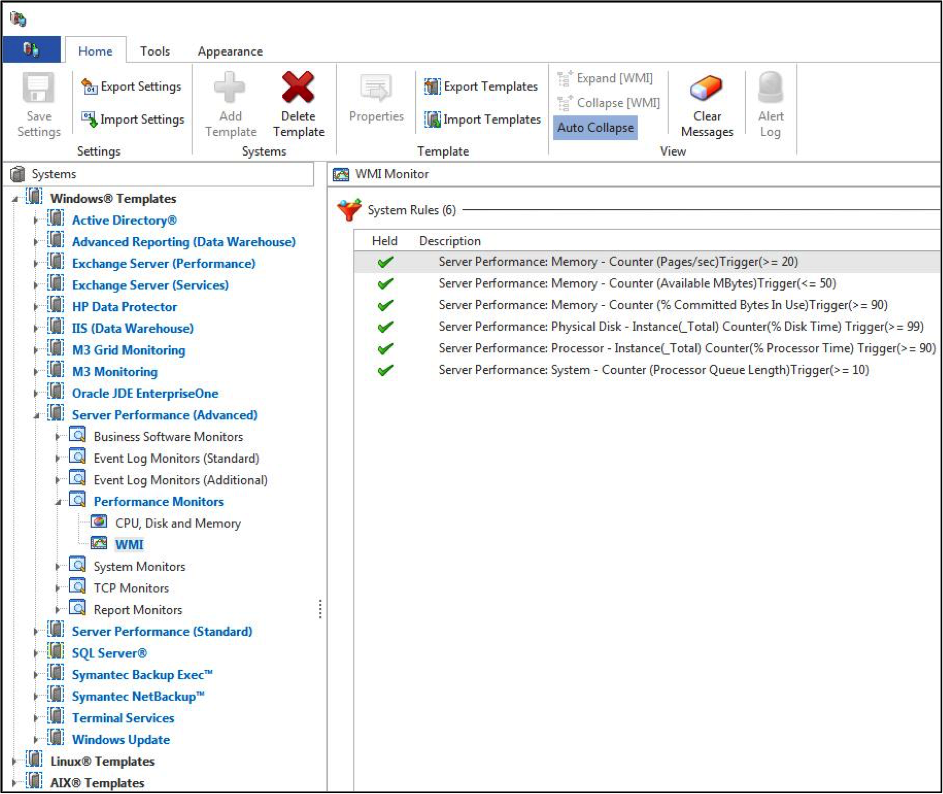
Figure 1 – Performance monitoring templates are available in Halcyon solutions.
Automated Actions
Once the monitoring has been turned on, the only decision to make is what to do should one of the thresholds defined in the rules be met. Again, built-in actions can raise an alert via any means imaginable—could be an email, SMS to your cell phone, or a graphical alert to a console.
By using a combination of these alerts, you can structure the notifications to find you wherever you are. If an issue arises overnight, some monitoring solutions have an action to automatically call your cell phone just prior to sending you an SMS to ensure you actually wake from your slumber.
A better approach—and my personal preference—is not to be woken in the first place! Select a monitoring solution that can also automate the appropriate action (or sequence of actions) that you would normally take to solve your most common issues as this will give you greater peace of mind.
Manage Systems on the Go
One of the trends I have noticed in recent years is that we’re under increasing pressure to manage the operations of a business with a much reduced IT team. We don’t have the luxury of sitting at our desks looking at numerous consoles and screens. In our jobs, we all have to attend meetings, write reports, manage projects and tasks, and constantly prove what value we add to the business.
My advice is to deploy a solution that gives you the flexibility to manage your systems on the go. There are monitoring solutions available that provide free apps so that you can access a management console showing alerts from your smartphone, tablet, or other mobile device. Personally, I find these devices are now a necessity, no longer a nice-to-have.
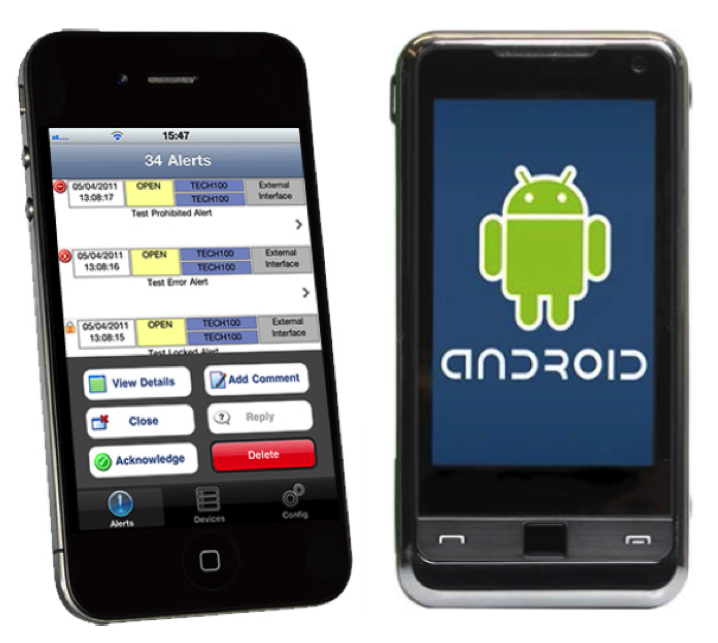
Figure 2 – Manage your alerts via smartphone and tablets.
Audit Trail
Ensure that you have a full audit trail of not only thresholds and alerts that have triggered but also any changes to the rule sets. This audit trail forms a critical part of the documentation used in the review part of the process.
Logic-Based Rules.
As demands on system resources fluctuate throughout the day, be sure that your rules and actions are fluid enough to respond accordingly. The rules that define the thresholds should have built-in intelligence that allows you to optionally:
- Alert only at times you’re interested in monitoring (i.e., specific time frames on certain days)
- Ignore short-term spikes, alerting on periods where sustained thresholds are being breached
For example, you wouldn’t need an alert each time the overall CPU hit 90 percent during a busy financial reporting period, but you would if CPU stayed at 90 percent for maybe a three-minute period.
Ensure that your monitoring has the ability to flex with the demands of the business. For example, the disk space utilized by your application database will probably increase when certain processes are running overnight, but the times at which these processes run varies each evening.
During this period you may want a different set of rules activated so that you’re not alerted for greater than 80 percent utilized, but instead are alerted for greater than 90 percent before switching back once the processes have completed. Having the ability to link rules based on something happening—or perhaps more importantly, on something not happening—is key for this type of scenario.
Service Level Reporting
It’s imperative to have a complete cross-section of the system at regular intervals (all with negligible overheads) as this data can be used for reporting purposes during the review part of the process.
The ease of report creation should also be considered as this is something you will perform time and time again. The creation of reports should be as close as possible to point-and-click so that you can add easy-to-view management content underpinned by data that populates your graphs and tables.
In addition, each element of the system you are monitoring with intelligent rules must allow you to say whether it forms part of a Service Level Agreement (SLA). For example, if a webserver, subsystem, or service is down, an application is deemed unavailable to the user/customer. This could constitute a broken SLA. You must not only track the availability of the webserver, subsystem, or service, but also measure, record, and report on whether the SLA target has been met on a minute-by-minute basis.
Step 2: Adjusting
As we’ve seen, choosing the right tool can ensure that monitoring and alerting are easily taken care of, but what happens if you want to schedule changes or make adjustments to the configuration of your machine on the fly, based on certain events happening or even not happening?
Let’s use an example that I’m sure sounds familiar to many of you: users running intensive queries that grab CPU causing the rest of the user community to suffer.
Actually, what really happens in this scenario is that when the system appears to slow down, many users hit the keyboard harder under the pretense that it will make the system respond quicker! In addition, IT personnel start running commands or utilities in a vain attempt to determine why the user community is reporting that the system is slow while inadvertently making the system even slower.
What if you could set up a couple of rules and actions to handle this whole scenario for you, and then forget about it forever? Good news, you can.
In addition to the standard methods of alerting, many monitoring tools come with the ability to run a command or call a program if one of our thresholds is met. If we take our intensive query situation, we could create a rule that states that if an interactive job consumes say more than 10 percent of the available CPU for anything longer than three minutes, lower the job’s run priority (or maybe hold or end the job) and email the IT support team, notifying them of the user responsible and amount of CPU that triggered the rule.
This allows you to take a closer look at the job in question and contact the user before dealing with the job or process responsible, if needed. Of course, this is a rather simplistic example, but even the most complex requirements can be configured to allow you to refrain from the constant firefighting that busy systems often dictate.
Remember, if you have any SLAs in place, it’s imperative that you also track them 24/7.
Step 3: Review
As you learned from the Three Essential Steps to Successful Performance Management article, there should be four sections in your review documentation. Let’s look at how the right tool can impact each area.
Baseline
By utilizing built-in templates, you can easily report on what your system looks like right now in terms of configuration. This baseline isn’t just an estimated configuration; it’s a result of previous exercises for which all of the data remains intact, allowing you to reference it time and time again.
It also follows the adjustments you’ve made both manually from your meetings with the business and automatic adjustments that have taken place as a result of benchmarks being reached and actions being performed. You should decide how long you want to retain the data to meet your on-going reporting requirements.
Monitoring and Alerting
The second section should depict what you have in place. This can be a laborious task manually illustrating what you have defined and why you have defined it. Look for a simple way to extract this, allowing you sufficient space alongside each rule and action to describe the reasoning behind it so that it can be understood not only by yourself but by any other member of your team as well.
Adjustments
Having captured the adjustments that have been made to the system (both the before and after settings) and your measurements at regular intervals, you can see at a glance the results of these changes. There is no room for guesswork as you have the results stored in minute-by-minute snapshots, allowing you to report on any period of time and cross-reference against any number of components that make up your system.
Recommendations
Based on what you’ve seen and extracted from the data collected, what should be your recommendations for the next steps? These steps should be defined as immediate, short-term, and long-term.
Having the data available to you makes your job far easier as you’re able to draw on historical data to map trend analysis, highlight bottlenecks, and predict future areas of growth.
Your recommendations should also illustrate the performance SLAs with the business and whether or not these SLAs have been met (or not). Where the SLAs have not been met, it’s good practice to add some footnotes to explain in detail why they were not achieved.
Advanced Reporting Suite ships with reporting templates that include a summary at the top showing average figures through the period reported on. It also provides graphs that show at-a-glance statistics.
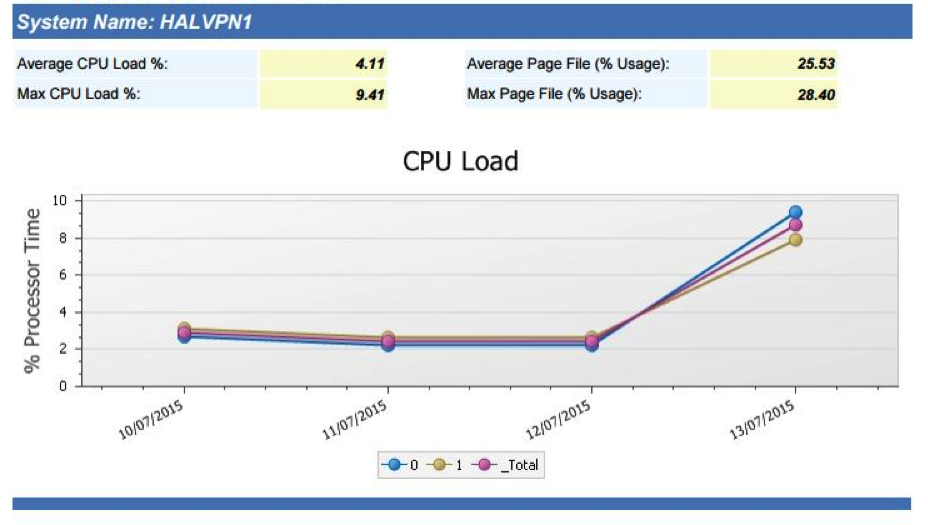
Figure 3 – Provide graphical reports on performance statistics including CPU load, page files, and disk usage to senior management.
The reports can be can be extracted in nine different formats, including the ability to export as PDF, JPEG, RTF, and HTML. This provides you with the mechanism to easily share your work, even allowing you to publish the reports on your intranet for your customers and users to view.
Tools like this help you create reports based on facts and figures extracted in a common, consistent way, allowing you to confidently predict exactly what’s going to happen and when, taking the guesswork out of the equation.
In fact, the whole performance management process, when approached in a structured way and armed with the right tool, can be controlled and managed at a pace to suit you.
By utilizing the flexibility of modern monitoring software, along with some common sense, you can ensure that not only IT but the business as a whole sees you and the work you perform as a real asset.