You have a ton of data on your system, and Sequel Data Access helps you make sense of it. With Sequel Host Reports, it’s easy to aggregate data and understand where your business is at. All you need to do is build calculations, and the Host Reports will dynamically summarize detailed information in a digestible format. You can even deliver the results in PDF—interactively or via a scheduled job.
What does a Host Report look like, exactly? Take a look at the example below to get an idea of what you should aim for with your Host Report—then continue on for tips on building Sequel Host Reports.
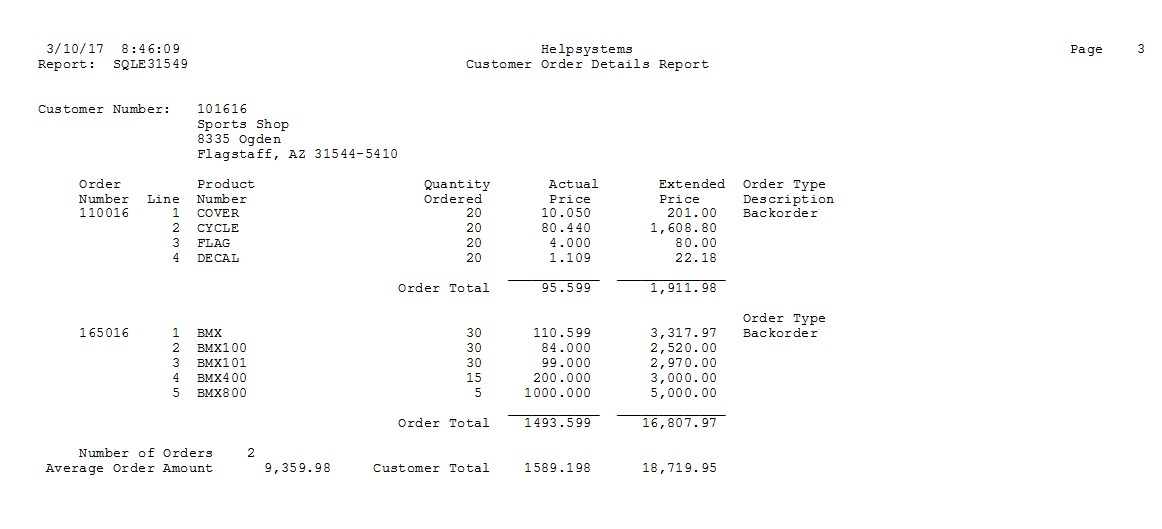
Your report could include sections for region subtotal:
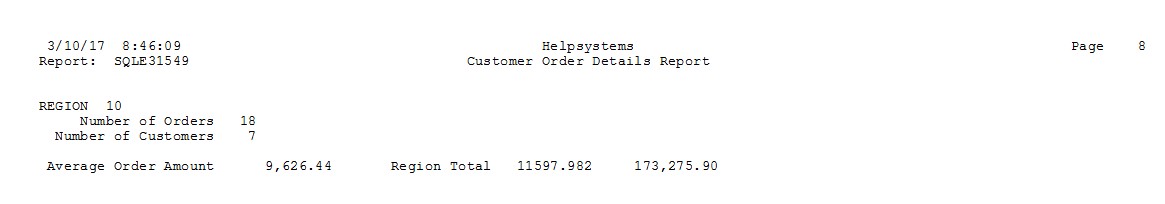
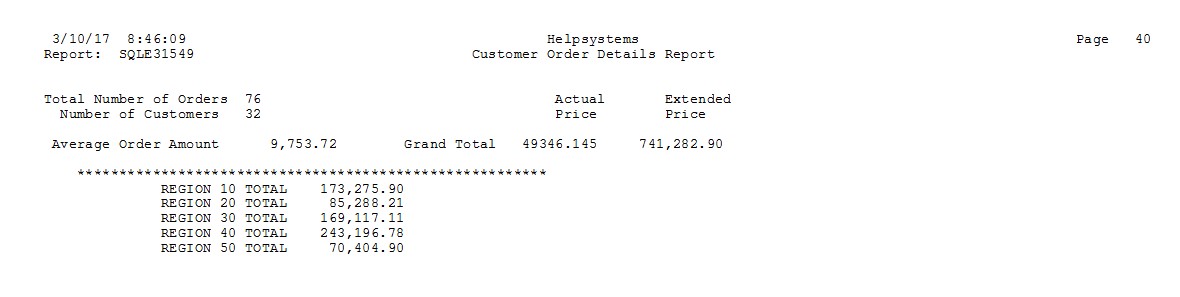
It could also include grand totals and summaries on a separate page:
Not using Sequel yet? Learn more about reporting solutions >
Ready to get started with your Host Report? Then take an existing Sequel view—packed with information, built with derived fields, and sort order chosen—and follow these tips.
Tip #1: How to Create a Host Report
First, open Sequel Viewpoint. Select an existing view. Then right-click and select “Report.” You’ll have the opportunity to walk through a simple four-step wizard to set up your Host Report.
- Determine title and format for your report.
- Select which fields to include—these will be the headings that appear on your Host Report. Pro tip: control the order from left to right using the arrows.
- Select the fields you want to calculate subtotals for—typically, these include price and actual selling price.
- Choose your break levels (where a subtotal will be calculated). Pro tip: break levels come from the “Order By” in the view. You can often skip the lowest break level as this may be the detail lines. Subtotal at the higher break levels for a more useful report.
That’s it—your Host Report is set up and you’re ready to dive into calculated fields (the calculations that will summarize your data).
Tip #2: The Fastest Way to Add Calculations
There are multiple ways that you can get started with calculations. The easiest way is to select “New” under calculated fields in the left-hand pane. That will pop up the calculated fields window.
Alternatively, you could select “Edit” then “Calculations” from the top navigation. Or, you can right-click on the screen and select “Calculations” that way. It’s the same window no matter what.
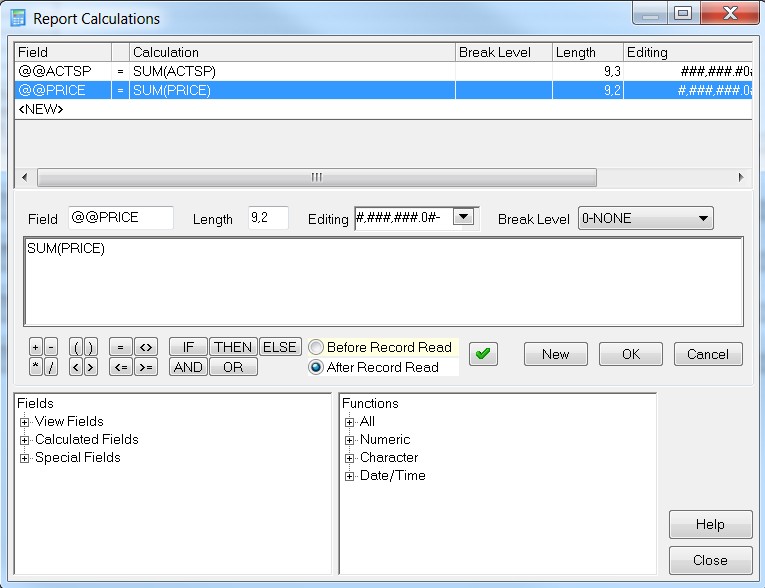
This is where you determine which fields—the ones you selected when you started the Host Report—will follow which calculations. These summary fields (@@ACTSP and @@PRICE) were created in the wizard (in step three). The can be created here instead.
Typically, you’ll want to build calculations for “After Record Read”. A “Before Record Read” calculation would only be used when there’s a change at a higher break, customer level in this example.
Tip #3: Simplify Your Calculations
The best way to create counter calculations is to set the calculation to add one to itself at the desired break level: field + 1. For this tip, we’re focusing on essential calculations for Sequel Host Reports. See the highlighted example below.
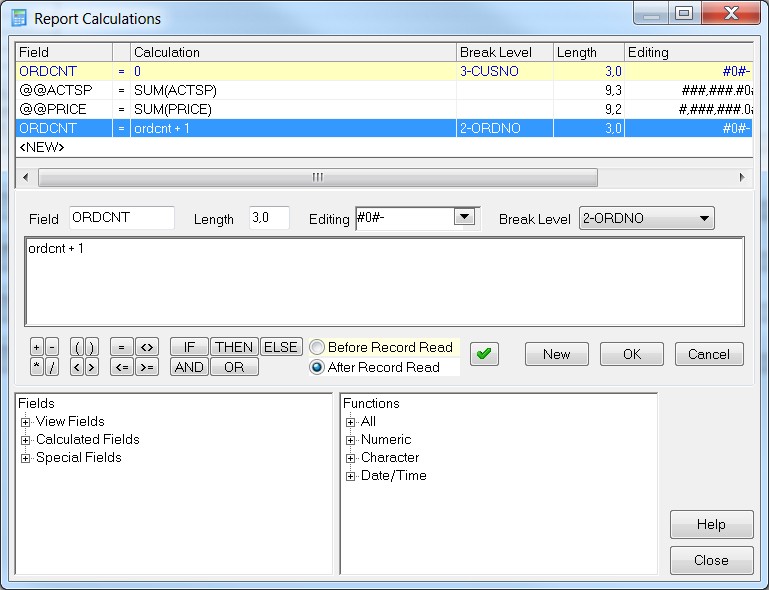
In this case, you’re setting the calculation for ORDCNT—which is the number of orders per customer. By setting a break level on the calculation, the calculation will be done only once per order. Be sure to follow the exact formula for your count calculations. The field ORDCNT clears at the start of each customer and counts the orders for each customer.
Just like order count, you’ll want to create the calculation for REGORDCNT (region order count). Reset your counter before you get started by selecting “Before Record Read.” Then you can proceed with your calculations in “After Record Read.”
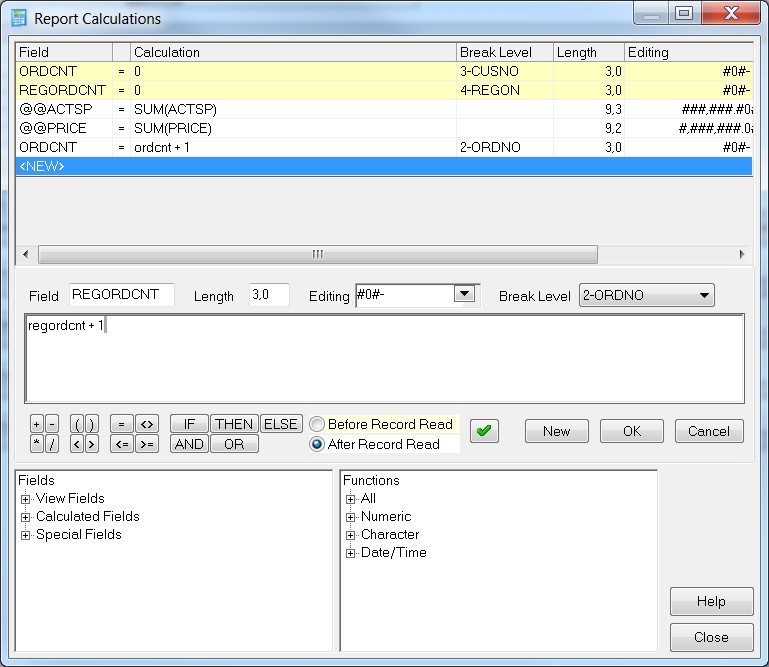
This counts the number of orders at the region level.
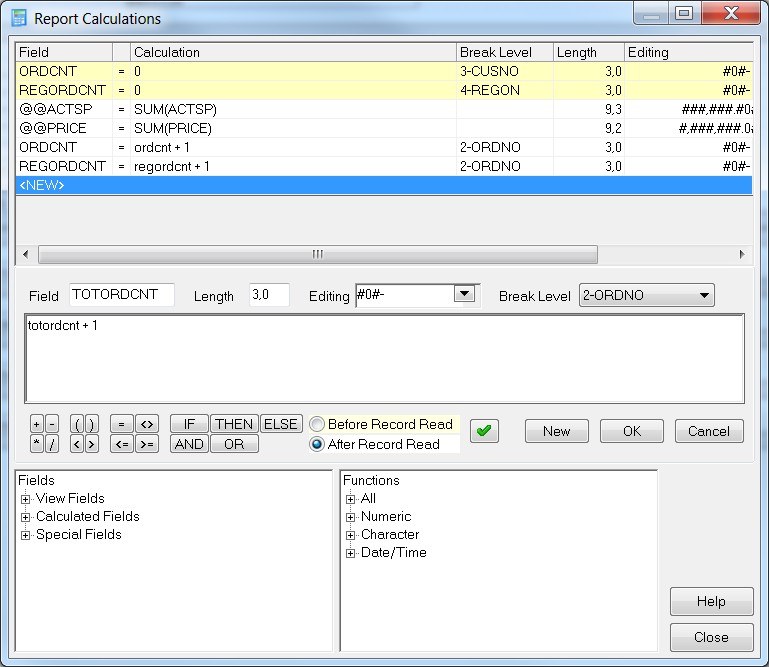
Next, count the number of orders from top to bottom using a new total order count field. This will accumulate the order counts without being reset or cleared.
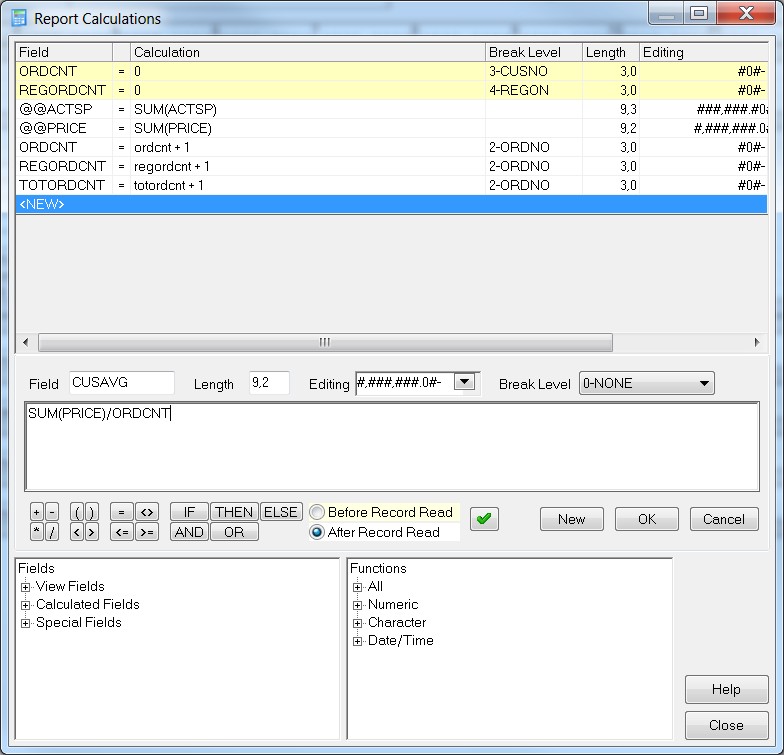
Another essential calculation to automate in your Host Reports is the customer average order total. You’ll find this by dividing the price by the order count.
It’s also a good idea to find the average per region. Use the calculation below to take the region count at each level and summarize them to get the average.
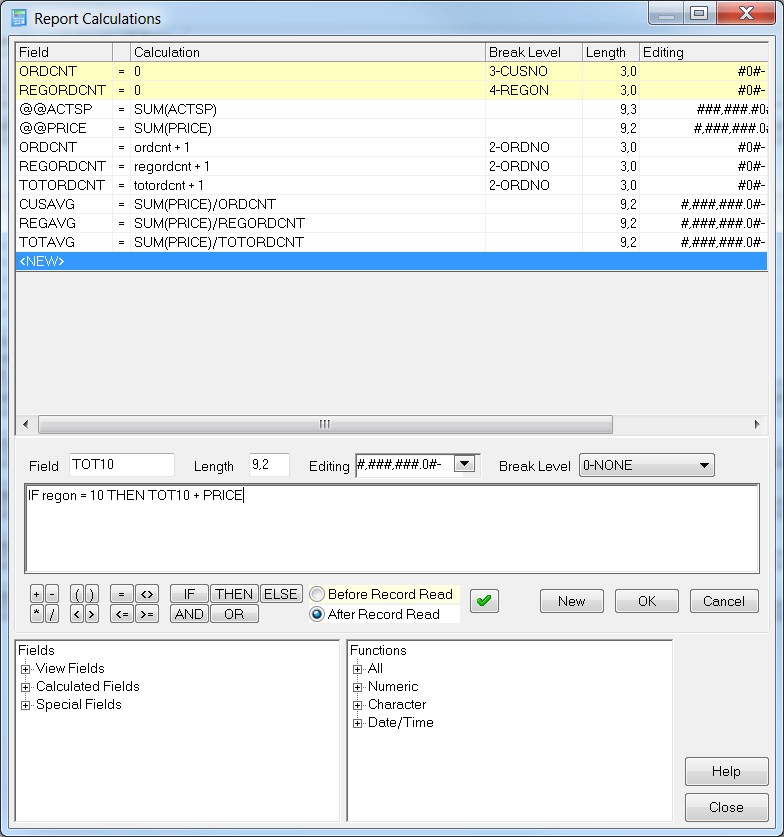
Next we’ll build the summary fields for the end of the report. This uses an if-then calculation. So, if the region is a certain number, then accumulate the total price for that region.
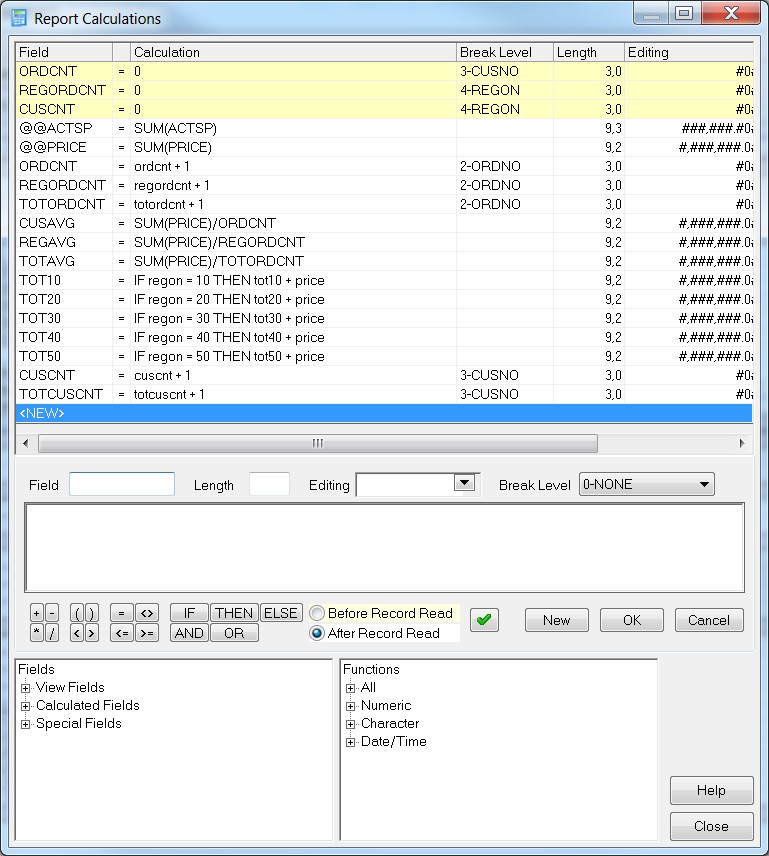
Once you’re done adding calculations, your window should look like this:
Tip #4: Maximize Your Final Report
Did you know that you can drag-and-drop fields and sections on your Host Reports? This is one of the easiest things you can do to get your final report to the state you need it in. All of the fields and sections below can be dragged and dropped to meet your needs.
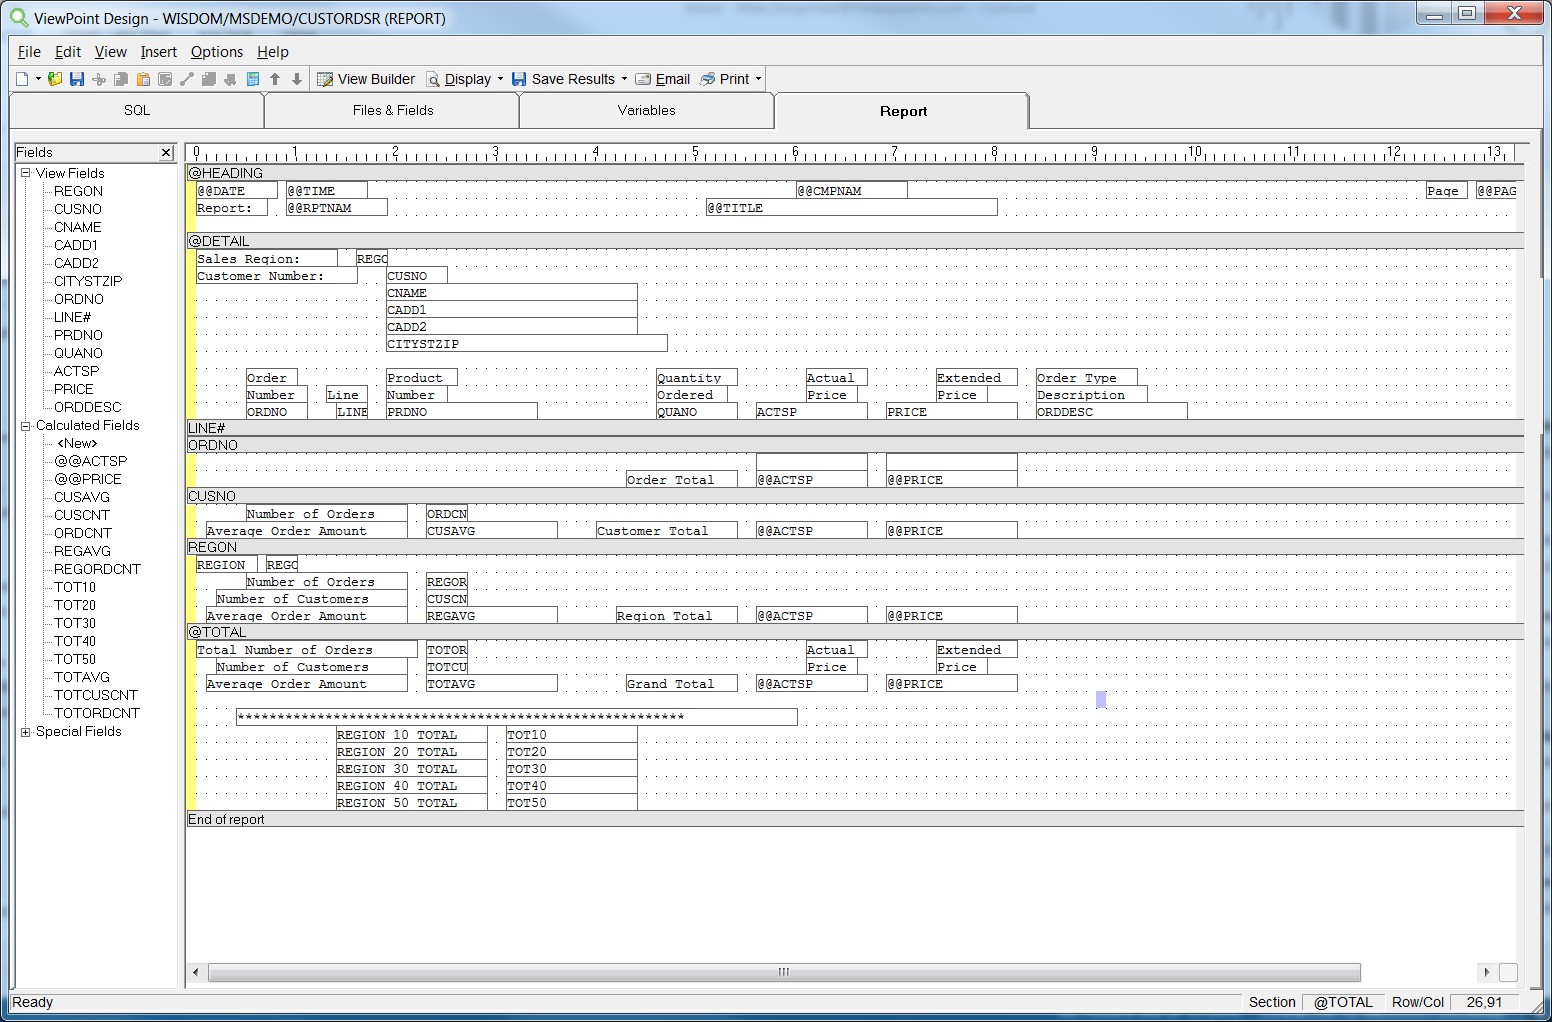
The goal of your final report is to have everything you need in one spot, broken down into customers, regions, and average. It also helps you look forward by providing the if-then statements.
Once you’re ready, the report can be run interactively from the browser, Viewpoint on your PC, or on a green screen. It can be displayed to the screen, sent to a printer or output queue. You can email the report as an .RTF, .PDF, HTML , .TXT file. Plus, you can even schedule a job to email or print the final report.
With these tips and tricks in mind, you’ll be able to build the dynamic Host Reports your organization needs.
Get Started Today
Fortra offers robust Sequel training throughout the year to help users like you do more with Sequel, from building host reports to delivering dashboards.