Do you need to export transactional data from IBM i for analysis? Is the amount of data too large for your computer to handle? Do you need to move (pivot), rearrange, or slice and dice the data to use more easily? Do you have staff members that need to take the data on the road with them?
You can download data from your System i DB2/400 database to your desktop using tools such as FTP, Client Access, JDBC, and ODBC. The problem is that your PC may not be able to handle the volume of records that can result.
It would be nice to have a way to summarize the data quickly. With Sequel Data Access, you actually can.
Sequel Gives You Options
With Sequel, you can easily create spreadsheet-like tables that can be downloaded, exported to Excel, or used interactively for detailed analysis.
Sequel offers two easy-to-use table options:
- Host tables (for pivoting data)
- Client tables (for drilling into the detail dynamically)
Today, we are focusing on Sequel's host tables. (For more information on client tables, read this how-to.)
Watch the video (or read the walkthrough) below to see how you can do more with Sequel's host tables.
All you need to do to create a table is follow the table wizard. And it will only take four simple steps. Plus, with the intuitive design interface, you'll be able to modify and enhance your tables quickly and easily.
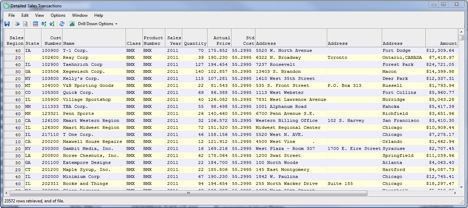
Below, is how downloaded transaction data might look in a standard Sequel view. Without Sequel tabling, this type of request could mean millions of records. That's too much data to send to the average desktop.
But with Sequel's host tables, you can quickly and easily summarize all these transactions.

A Sequel data view before tabling.
View Spreadsheet-Like Summaries
You can use Sequel host tabling to automatically summarize System i DB2 transaction data into spreadsheet-like files with summary rows, columns, and totals. You can enhance your table by adding rankings, percent of total, and other calculations.
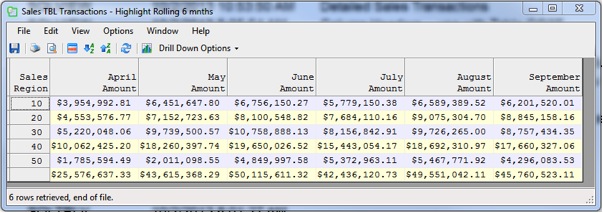
The Sequel host table below organizes data into columns for regions, time periods, or other categories. And, you can output this summarized data to multiple formats, including XLS, XML, or CSV.

Sequel view data organized using a host table.
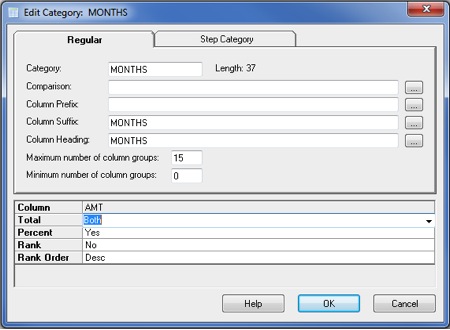
You can also add in the summary by rows and columns and other options. Simply right-click the "Categories" field and select "Edit" category as shown:

Then select the options you want. For instance, choose totaling “Both” directions for vertical and horizontal totals and add percentages.


Sequel view data organized using a host table with percentages and totals (above)

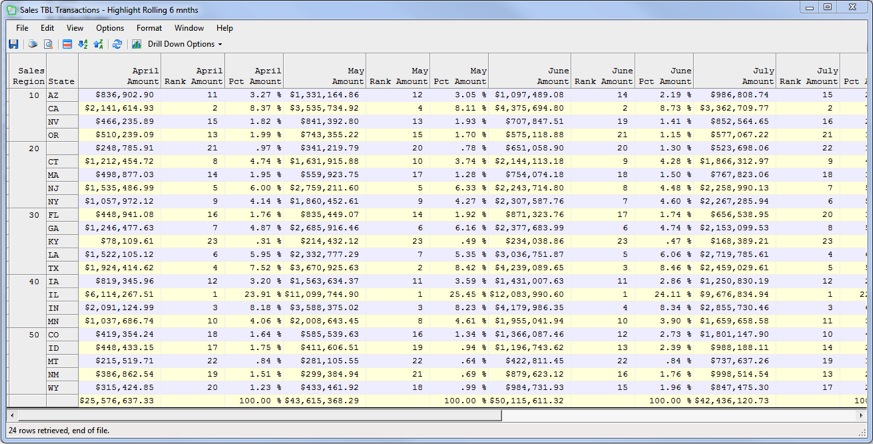
Sequel view data organized using a host table with percentages, ranking, totals, and the state field sliced into the dimension.
Easily Save Table Results in Numerous PC formats—like Excel
Next, it's time to output your host table. You can do this either from the table results display or from the main Viewpoint explorer screen. Save table results locally or on a network drive to share. You can even email the file.
To make it even easier, you can automate the process by using the table view in a Sequel script. There are so many options.
Recap: Sequel Host Tables
Here's what you can do with Sequel host tables.
- Column fields can be character or numeric
- Results can be emailed in various PC formats
- Results can be saved to the IFS
- Results can create physical files
- Can be scheduled easily
- Conditional columns can be created
- Percents of totals can be calculated in more than one group
- Can be run from Sequel Web Interface (SWI)
Do More with Sequel
Already using Sequel? Explore Sequel's diverse training options and build your Sequel skillset.