Year-end reporting is coming…
Are you ready? Do you know your options? Are you prepared to collect all of the data you need to see how your company fared for the year?
You’re in luck, because Sequel Client Tables make year-end reporting a breeze. Drill down into the level of information you need for your reports. Compare data across multiple years to spot trends and add context. And highlight key data to draw attention to exceptions or anomalies.
Once you have the key data, it’s easy to draw conclusions on the past year and make informed decisions for the next year.
What Are Sequel Client Tables?
Sequel Client Tables are an interactive OLAP solution that provide dynamic data mining and data analysis. Client Tables offer a wide array of drill-down, reporting, and analysis features. You can use its drag-and-drop formatting to reorganize the rows and columns of the table and view the results. Multiple data filtering, drill-down, data marking, dimensional pivoting, ranking, and graphing functions are also available.
Client Tabling Offers:
- Easy-to-use design interface
- Interactive drill-down into detail level
- Dynamic data filtering, pivoting, and ranking
- User-defined calculated fields and number formatting
- Many aggregation functions, including sum, average, standard deviation, and variance
- Print, preview, and zoom functions
- Automatic size-to-fit for rows and columns
- Filter row and column contents
- Save results as Excel (.xls), HTML (.html), and Client Table (.vpc)
Plus, you can even save Client Table results to your computer (as a .vpc object) to turn your data into portable information. Doing so allows you to work disconnected from the IBM i by using the Client Table Viewer. You’ll be able to quickly and easily rearrange data or slice and dice the data as needed. And you can do it all without impacting your system.
Learn how to build Client Tables >
Compare Data with Years Past
With Client Tables, you will be able to quickly and easily compare and pivot data over several years. You can even compare data from many different angles. For example: you want to group all the data by year, then by year and quarter, then by region and product, and so on.
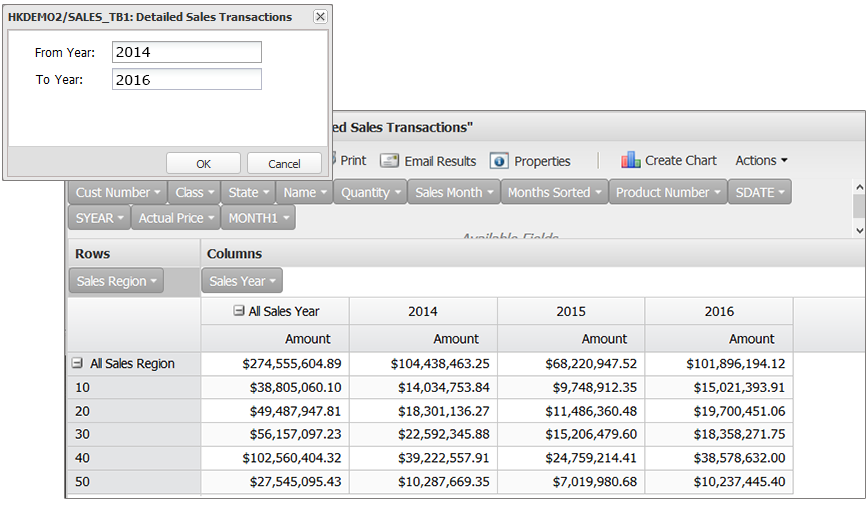
Client Tables will prompt you to enter the year (or years) that you wish to review. Select more than one year to compare multiple years. If you’re building a Client Table for your users, you can also add run-time prompts to allow the user to select information. For instance, your user might select a specific year or region to examine.
It’s okay to change your mind or to look at the data in numerous different ways—each way helps you analyze the year-end numbers.
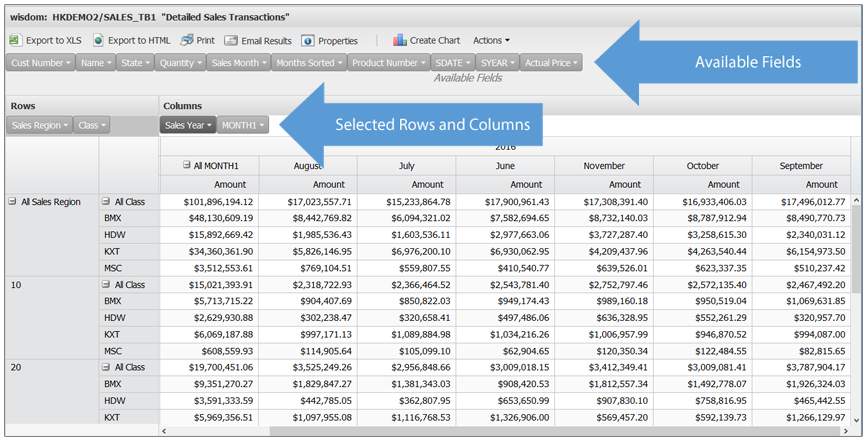
Slice and dice the data very quickly by pivoting the row and column fields.
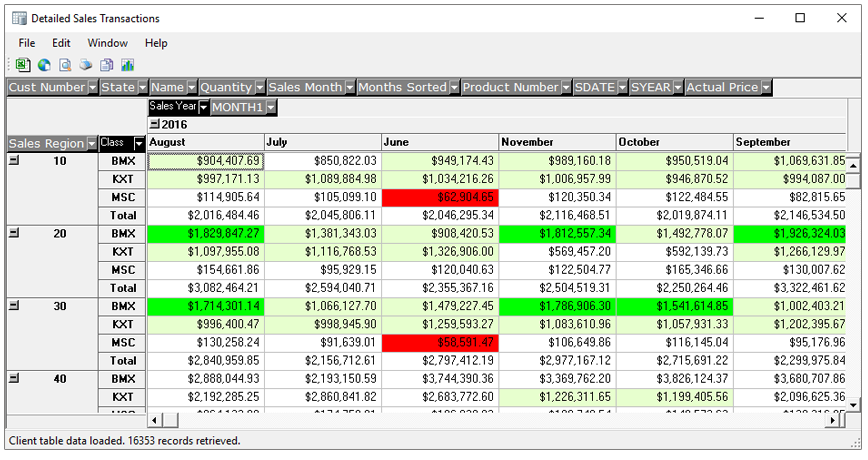
You can also drag a column into a row to take a closer look. In the example below, doing so will give you detailed information on which product line is selling the most in each region for the past four years.
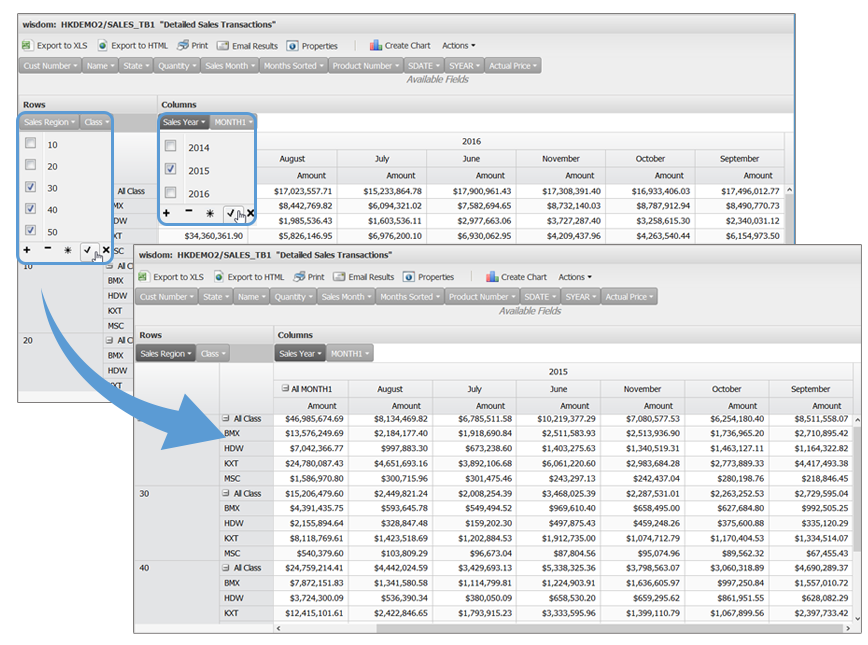
Plus, you can quickly select or filter certain sales years and regions—and you won’t need to rebuild or rerun the Client Table. Simply click on the drop-down arrow shown and select the information you need.
Drill Down to the Detail You Need
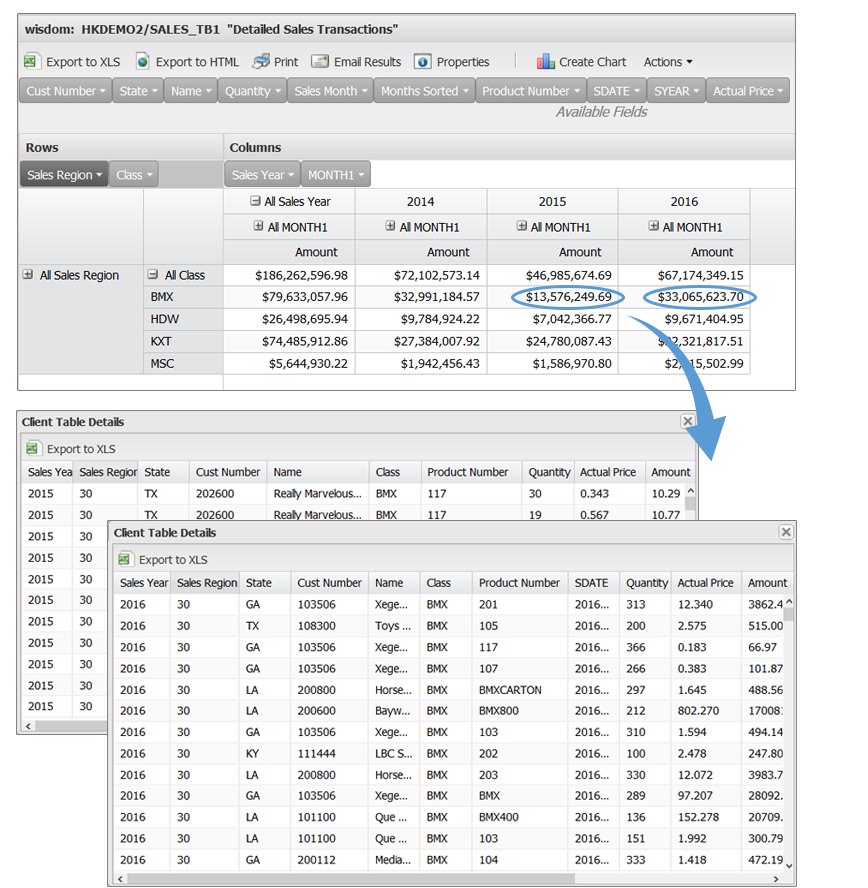
Once you’ve selected the years you’d like to examine, you can then drill down into the level of information you need.
To drill down into the detail, simply double click a cell. Double-clicking displays the information behind the scenes.
If you wanted to compare a couple of different data cells, you can simply click on them both to compare. When comparing data, it helps to have a question or hypothesis in mind, such as: Why are the Americas doing so much better with their book sales?
Analyze Data and Highlight Key Details
Comparing data over multiple years and drilling down into the detail helps you to understand what’s going on in your business. There are other ways to analyze your data in Client Tables, as well. For instance, data markers are a powerful way to highlight data.
Use data markers to add both informational and visual impact to your table results.
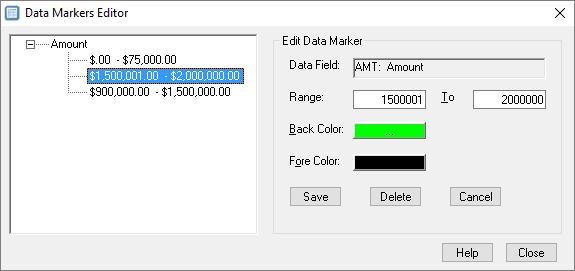
To get started, select “Format” in the design menu and then choose “Data Markers.”
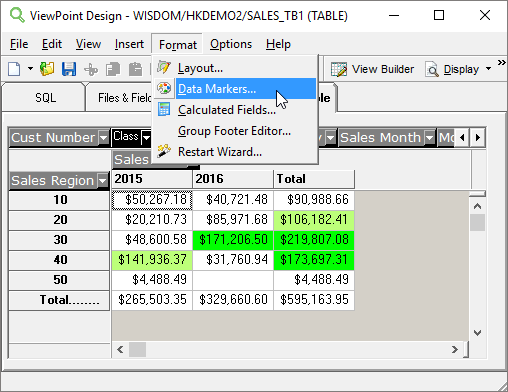
Once you’re in the “Data Markers” editor, follow these instructions:
- Highlight the field you want to base the marker on (amount).
- Enter a low and high value for the range.
- Click the foreground or background buttons to open a color palette and select a color.
- Click "Save" to add the defined range to the list.
- Click "Close" to save your changes and return to the table.
The markers you define are saved with the table and will be applied automatically every time you run it.
In this example, data markers help you quickly see that book sales are doing very well in the Americas, but remain down compared to last year.
Enjoy Simple Yet Thorough Year-End Reporting
Once you’ve finished comparing and analyzing data in the Client Table, it’s quick and easy to get the final year-end data you need. Client Tables allow for fast calculation, summarization, and presentation of multidimensional relational data. Plus, you don’t even need a multidimensional database.
The number of data points to display is limited only by the resources of the operating environment. And, you can highlight data based on your specifications, reveal or hide detail levels in summary views, and analyze any number of dimension and fact.
With Sequel’s Client Tables, you can finally reduce the stress of year-end reporting.
Do More with Sequel
Fortra offers robust Sequel training throughout the year to help users like you do more with Sequel.