What Is IBM MQ?
IBM MQ is a middleware product that allows messages (think data or information) to be sent and received to and from similar or dissimilar platforms with guaranteed delivery.
IBM MQ has been available in various guises since 1993. As you’d expect from such a mature IBM product, it’s often considered the de facto standard whenever a business must move data across platforms.
In recent years, there has been a huge trend to use the internet for real-time transactions. This has given IBM MQ a new lease of life.
Today, IBM MQ is widely used in organizations across many industries:
- Manufacturing
- Finance
- Distribution
- Pharmaceutical
- And more!
IBM MQ is very much the first choice for a transport layer where there is a need to integrate heterogeneous applications.
The perception of the IBM MQ user community is that it is a stable product. So, does it need to be monitored or will it effectively self-check and more importantly, self-heal?
This guide explores a cost-effective solution for monitoring the cornerstone of many businesses, namely IBM MQ running on the IBM i platform.
How Does IBM MQ Work?
IBM MQ allows application programs to use a message-queuing technique to participate in message-driven processing. These messages have two parts:
- The header
- The application data
Application programs then communicate across different platforms by using the appropriate IBM MQ solution for that platform. The business applications are not dependent on the underlying mechanics that allow communication between disparate computer systems; MQ takes care of that. This removes a layer of complexity and reduces performance or reliability concerns so that application programs function as expected.
Due to its flexibility, its ability to span many different platforms, and the overall robustness of IBM MQ, it can also be used as a viable substitute for FTP (file transfer protocol).

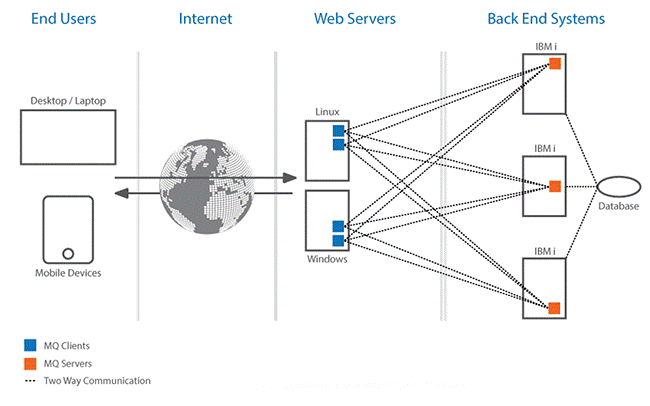
Figure 1: Typical order processing via an IBM MQ environment
IBM MQ supports more than 80 different platforms (and rising)!
Many organizations choose the stability and overall longevity of IBM i to house their IBM MQ server—as opposed to clients, which often reside on Windows, AIX, or Linux—effectively making IBM i the most critical platform in the business. IBM MQ provides a seamless integration and a backbone for messages, files, mobile devices, and even cloud computing.
End users or customers may access the internet using a Windows desktop, a Linux tablet, or even a Smartphone. They will simply see their tried and trusted browser and have no need to know what kind of back-end database they are communicating with in order to complete their transactions.
This type of communication is handled by IBM MQ or a similar product.
IBM MQ Is Stable, So Why Do I Need to Monitor It?
In the image above, if a customer suffers a delay or a failure in trying to place this order, they’ll see an error message on the screen or the session will time out. At this stage, there’s a 40 percent chance of the customer retrying the request. If the request fails again, you have a 12 percent chance that the customer will make a third request. Putting it another way, that’s an 88 percent chance that you’ll lose this business to a competitor.
Normally, IBM MQ looks after itself and guarantees data delivery via an embedded asynchronous approach to data transfer. This approach means that it doesn’t matter if the target platform is unavailable at the time the source system attempts to send the data. The data will simply be queued and sent when the target system is back online.
- But how do you know if the target system remains unavailable for an extended period?
- How would you know if there’s a bottleneck somewhere in between the source and target system?
- How would you detect whether there’s a backlog of messages in a queue due to a firewall change?
The simple answer: use MQ monitoring tools to keep an eye on things.
Automatic Monitoring with IBM MQ Monitoring Tools
MQ Manager allows you to monitor the seven key metrics that make up an IBM MQ environment on IBM i. It proactively compares against predefined thresholds and provides real-time alerts.
Built-in templates allow support teams to set up a baseline for monitoring IBM MQ almost immediately, which can later be fine-tuned and tailored using customization techniques. The templates are derived from best practice industry standards to ensure that all key IBM MQ elements are covered.
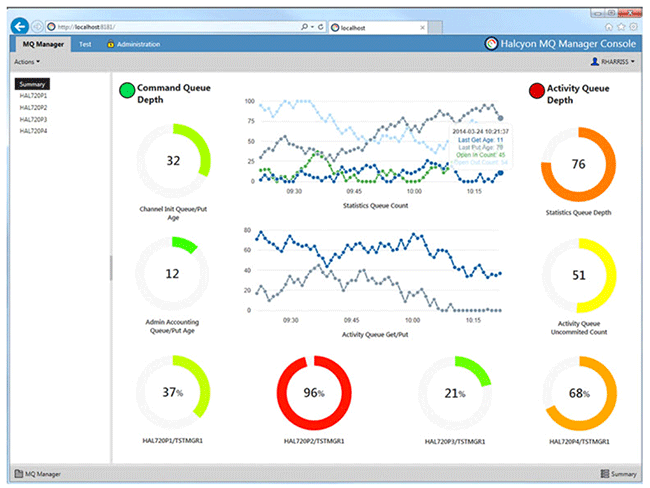
MQ Manager comes with a highly customizable graphical user interface (GUI) that allows you to see at-a-glance where potential problems exist. The GUI is browser-based and will run on any device with internet connection to provide continuous monitoring and notification to IT staff even when they are away from their desks.

Figure 2: MQ Manager GUI dashboard includes a traffic light status display.
MQ Manager proactively performs checks every minute of the day, removing this repetitious responsibility from administrators. Alerting capabilities can mirror any format that fits with your existing support structure, including email and SMS messages to individuals, groups of people, escalation lists, or support rotations.
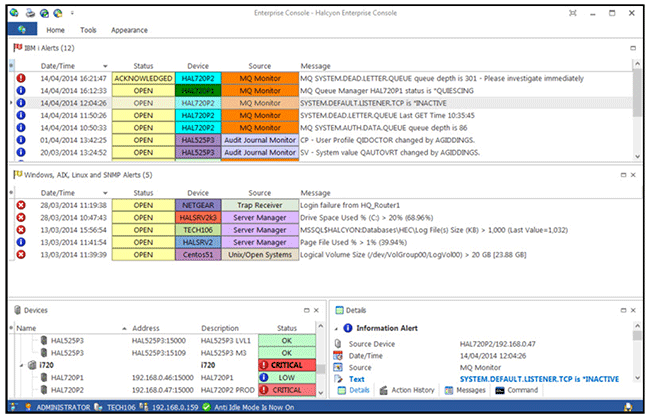
An additional option allows you to use the Enterprise Console, which proves a centralized dashboard—a single, graphical focal point for all support teams—for all your monitoring, regardless of platform.

Figure 3: Enterprise Console
Key Components of IBM MQ
IBM MQ contains seven key elements that are critical to the overall functionality and availability of the application:
Queue Managers
Queue Managers can accept, process, and deliver messages across a variety of different platforms spanning global networks. Queue Managers have a single status attribute. Generally speaking, for applications to be able to talk to a Queue Manager, it needs to be in an *ACTIVE state. However, if a Queue Manager is found in any other status, bottlenecks and problems are likely to occur.
Queues
There are many queues associated with each Queue Manager. Queues are best described as an area where messages reside before being processed. Some Queues see a constant flow of messages route through them. For others, finding even a single message could represent an issue.
Cluster Queue Managers
Cluster Queue Managers allow you to take a consolidated approach, providing generic control of two or more Queue Managers. They’re generally used in IBM MQ environments where there are many hundreds or thousands of Queue Managers. The main benefits of Cluster Queue Managers are simplified administration and having the ability to balance workloads across multiple Queue Managers (and therefore routes). A single status of note here is *SUSPEND. If you to see this status, it’s cause for concern.
Channels
Channels are objects that provide a communication path between the Queue Managers that make up an IBM MQ environment. These are either client -to-server or server-to-server paths. Channels can have eight statuses and an acceptable status for the Channels is *RUNNING. The other seven are possible causes of concern.
Listeners
Listeners are processes that detect and accept network requests from incoming Channels as well as managing the connection to the receiving Channels. There are three valid statuses available on Listeners. Here again, *RUNNING indicates an acceptable state where everything is running as expected.
Service Objects
Service objects define automatically-called programs that start when a Queue Manager starts or stops. There are three valid statuses available for Services and only the *RUNNING status is deemed acceptable.
Events
Customization can be applied to the setup of IBM MQ so that a logical set of events cause an event message to be placed on an Event Queue. For example, if a parameter is changed on a Queue Manager, an event message would be generated indicating the change.
Clearly, there are many variables that make up the supporting of the IBM MQ application. To add further layers of complexity, you may have IBM MQ running on different platforms, which may involve different IT teams across different parts of the world.
In these cases, each platform or technology owner maintains his or her area of responsibility with little knowledge or thought for other platforms. When there’s an issue, each person would have their own specific sphere of control, so problem determination can take quite a while. These delays directly impact to business end users. In many cases, the IT support team won’t know about issues until they are reported by the customers—and by this time it’s too late.
Is Reactive Manual Monitoring a Practical Option?

If you have no more than two Queue Managers in your IBM MQ environment, you might be able to monitor these manually. But that’s assuming you work 24/7, take no vacations, and have no other responsibilities.
Realistically speaking, this wouldn’t be a wise use of an administrator’s time. No sooner would the manual checks be completed, then they would need to be started again. In addition, the checks would only be valid at the time of the check; they would soon be out-of-date and of no value whatsoever.
Due to the mundane, repetitive nature of the checks, it’s totally conceivable that mistakes could be made or checks missed as more important or more interesting work surfaces. Without continuous status and threshold checking, you’re left with inefficient, reactive monitoring—waiting until a problem is reported while performing a limited series of standard checks based on knowledge gained from previous issues experienced, all after the event.
Since IBM MQ is so important, it’s recommended that you proactively and continuously monitor the environment. Best practices suggest automating the process and establishing an alerting system based on definable thresholds using sophisticated MQ monitoring tools.
MQ Manager Use Cases
To illustrate the depth and flexibility of MQ Manager monitoring software, let’s look specifically at IBM MQ queues in the following scenarios.
Backlogs
Queues are a place where messages are stored prior to being processed. In an efficient environment, the message processing is extremely quick with messages remaining in the queue for no more than one hundredth of a second. If you have a substantial volume of messages getting processed on a queue, it doesn’t take much time for a backlog to build up and cause a serious problem. You would need an extremely early warning signal to alert you to any potential issues. MQ Manager allows you to define these thresholds over individual or generic queues and set alerts to trigger if a message older than 10 seconds is detected on any user-created queue on the default Queue Manager.
Dead-Lettering
Dead-lettered queues occur when messages cannot be processed and routed to their intended location. Since the messages are data, they are critical to your business, so you need notification as soon as possible. Here are some possible reasons for messages to appear on the dead-lettered queues:
- Non-existing recipient
- Iincorrect recipient
- Recipient’s mailbox is full
- Recipient is unavailable
Decisions can be automated by using MQ Manager to discard, retry the delivery, or redirect the message.
Depth Counter
Similarly, you will want to ensure that message processing is taking place as expected and at an acceptable speed. MQ Manager has a depth counter, which allows you to receive an alert if a threshold is breached. From time to time, backlogs may occur. Often, the backlog will have been cleared by the time you’re alerted, since it was a temporary situation. MQ Manager accommodates for these scenarios with a clever feature allowing you to alert based on a sustained period of backlog as opposed to a sudden spike. This is all part of MQ Manager’s policy to monitor by exception.
These are just some examples in one of the seven areas where MQ Manager can manage your IBM MQ environment.
For advanced IBM MQ administrators there’s an ability to automate responses to reported issues by using the powerful built-in action to run a command. This allows you to make use of valuable in-house expertise and experience of the IBM MQ application by running IBM MQ or native IBM i commands to perform specific actions to maximize the full potential of automation.
What's Next for IBM MQ at Your Organization?
IBM MQ is a stable and reliable product that guarantees delivery of data that is essential to your business. However, there are common scenarios that can cause interruptions and delays to the flow of this vital information.
With the billions of real-time transactions that are taking place every day across the web, any failure to provide a continuous service to customers or users can lead to substantial loss of business and revenue.
Intermittent, manual monitoring is not a recommended option. You need continuous monitoring and the ability to responses automatically to any issues in order to address problems before they affect the business.
By implementing this MQ Manager, you will ensure that you have a regular, consistent, and tailored approach to monitoring your IBM MQ environment on your IBM i and substantially reduce business risk and cost.
Learn More about MQ Manager in a Live Demo
MQ Manager is a proactive, real-time solution for monitoring your IBM MQ environment on IBM i. Complete with pre-configured templates, it provides you with hassle-free, out-of-the-box deployment to ensure you are quickly up and running. By using a combination of the templates and in-house knowledge and experience, you can adapt your monitoring to provide the best fit for your IBM MQ environment. Request a demo to learn more.