Performance doesn’t have to be a problem on IBM i. The operating system gives you the ability to continuously collect performance data—without major overhead on the system.
IBM i has a feature called Collection Services, which is a toolset designed by IBM to gather the performance data on IBM i. Collection Services gathers the raw performance data that reflects an interval of time and the performance of the system, jobs, memory pools, and disk.
Robot Network has the ability to use this raw data, collected from each partition, and present it to you for analysis and as an early warning system for problems that might be just around the corner.
This data is essential for a few good business reasons. It can be used to:
- Diagnose performance issues
- Plan for future growth
- Monitor performance for exceptions before end users call to complain
Precision Monitoring
Managing your server by exception is especially important for performance data. With Robot Network, you can set up the interval for collections down to seconds (see figure 1) and establish collection intervals differently in each partition to get the precision you need when watching for issues.
Robot Network also makes it easy to add exception-based monitoring. You can configure elements of performance by each partition, allowing you to choose only important items from WRKSYSSTS or WRKDSKSTS.
For instance, you might want to be alerted if you go over a threshold of .5 seconds for average response time or if your Non-Database Faults are greater than 20 for memory pool 2 (see figure 1). This is very easy to do across all the IBM i partitions in your data center be they production, test, QA, or DR—they are all critical.
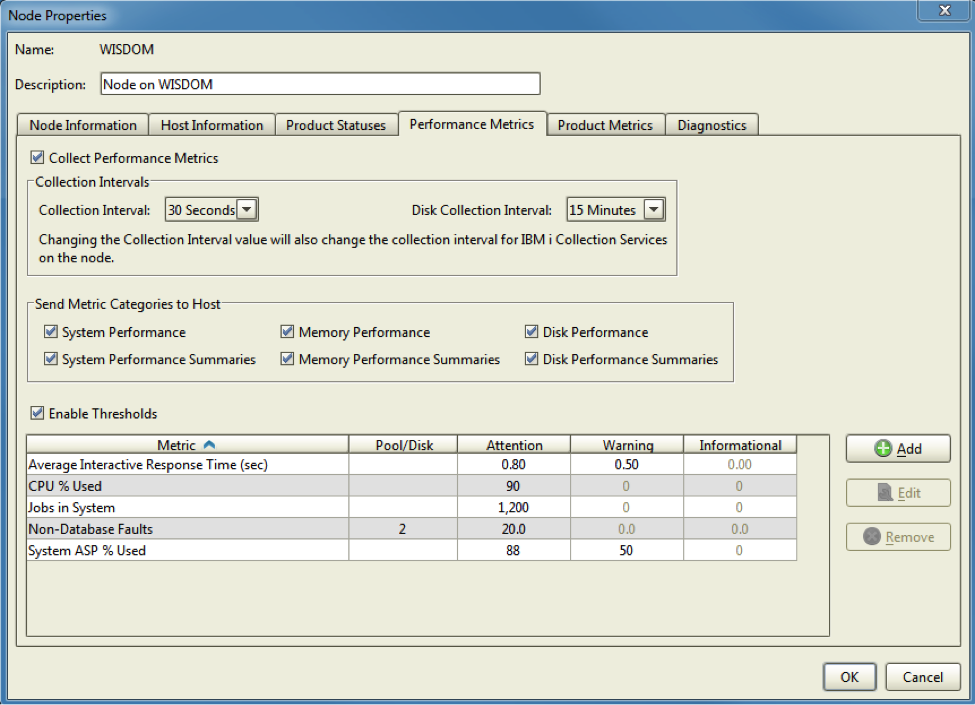
Figure 1: This figure shows performance collection intervals and thresholds.
Top-Flight Dashboards
Robot Network also features auto-refreshing dashboards in the Robot Network Explorer or in the Robot Network web user interface (see figures 2 and 3) to keep you apprised of your most recent data.
The product can also alert you for each interval collection, which can also be summarized and compared to the threshold. Threshold events go to the Status Center, which in turn can be set to notify you via SNMP, email, pop-up window, or desktop alert.
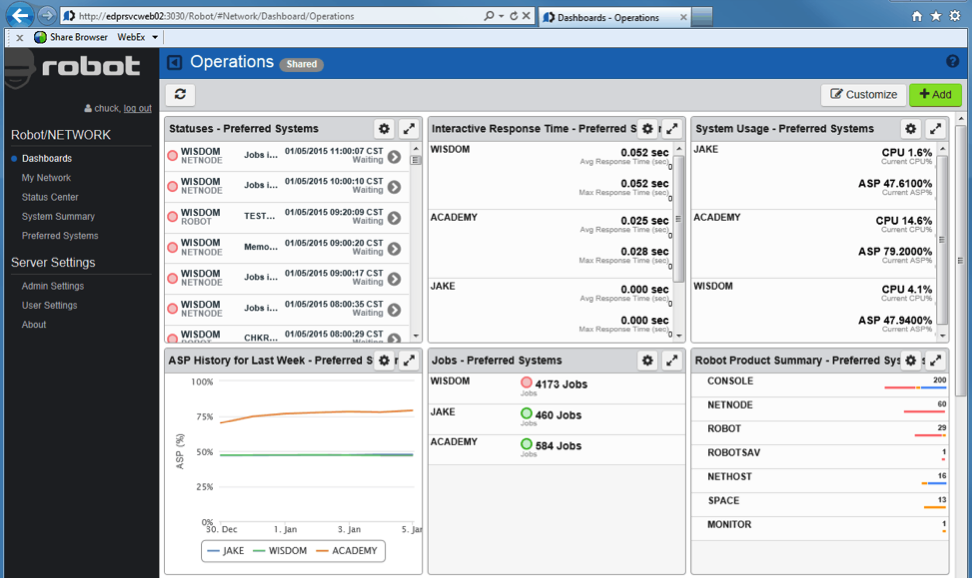
Figure 2: This is the Robot Network Performance Center dashboard.
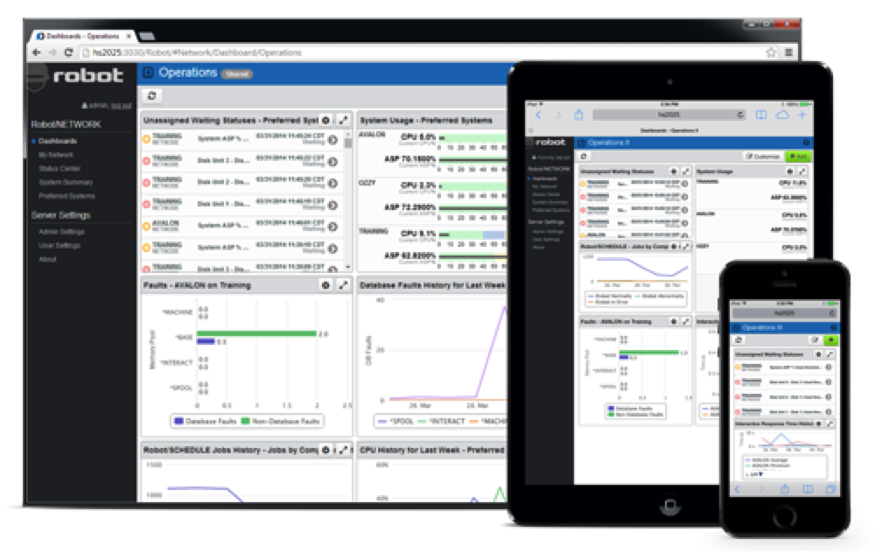
Figure 3: View IBM i performance information on your mobile device using the Robot Network we user interface.
Your Robot Data in One Place
In addition to IBM i performance information, Robot Network also can also help you keep tabs on your Robot products, including Robot Network statuses, Robot Schedule jobs, Robot Console messages and resources, report sets for Robot Reports, and save media for Robot Save.
The Robot Network Product Metrics dashboard brings it all to one place, in detailed form and in summaries.
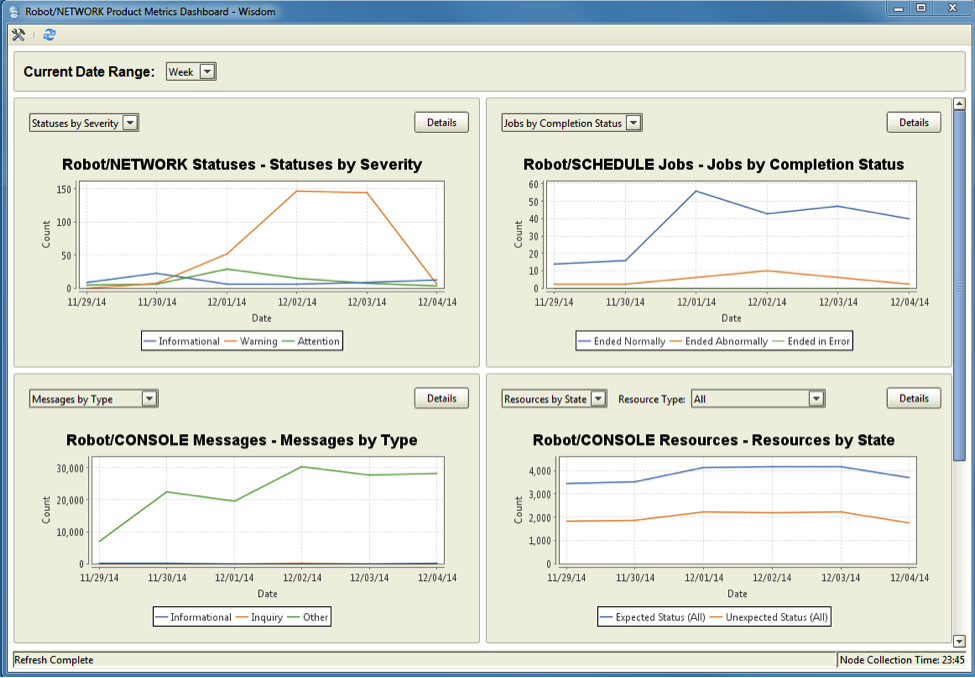
Figure 4: The Robot Product Metrics dashboard integrates monitoring of your Robot products.
Flexible Escalation and Assignment
Here again, all of the assignment options at your disposal in Robot Network—including SNMP traps, calling a user program, and Robot Alert messages—can be combined to escalate statuses (see figure 5). You can send them simultaneously or triggered in succession after a designated time passes with no response. Many use the SNMP interface to send events to open problem tickets in tools like Remedy or escalate events to tools like HP OpenView or IBM NetCool.
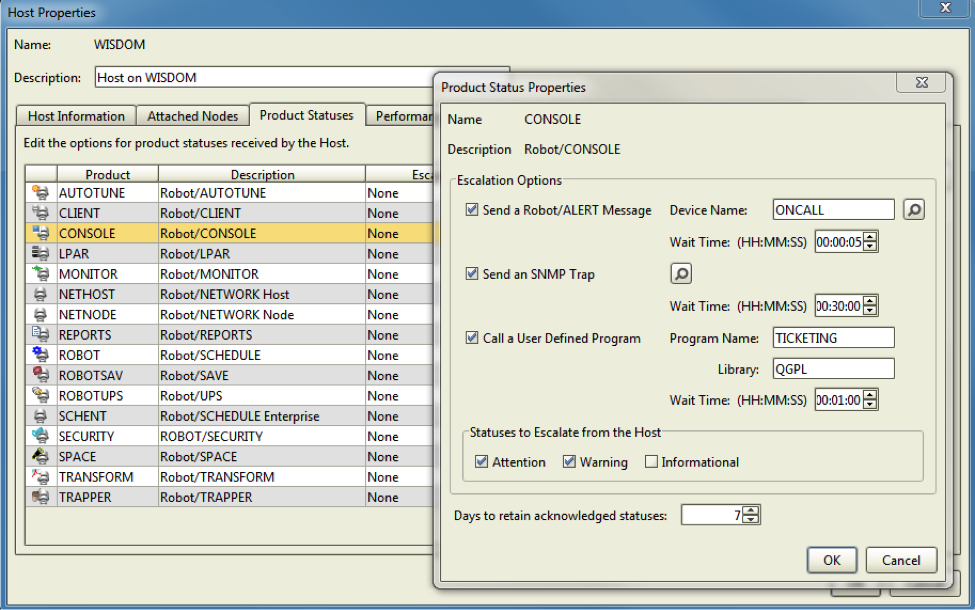
Figure 5: You have many, flexible escalation options with Robot Network.
The Robot Network Status Center also offers two assignment options: “Assign to User...” and “Assign to Me”. From the My Waiting Statuses tab, users can see details about the message, reply to the status, un-assign and reassign, and more.
Easier Network Organization
Using the Node Groups feature, you can logically group, display, and work with partitions and systems. For example, you might use Node Groups to group nodes by time zone, serial number, or business unit. You could then see the performance my serial number that may have 10 partitions running across it.
Robot Network gives you a central location to monitor IBM i performance and Robot product statuses, making sure that you’re aware of any potential issues that might cause you to miss your SLAs.
Get Started
Manage your all Robot software across IBM i systems and partitions from one convenient status center. Request a demonstration today to learn more.