In the era of big data users need to view their data in a way that makes sense and lets them dive deeper. SEQUEL’s Client Tables are an interactive solution, much like pivot tables, which allow users to reorganize and summarize columns and rows of data in a spreadsheet-like format both on a PC and on a mobile device or tablet.
With Client Tables on the go, you can access data from your office, in the hallway, or in a meeting on the other side of town. You will be able to quickly and easily compare and pivot data over several different years, departments, products, inventory, regions, sales, and so on. With Client Tables (pivot tables), you can view your data in the exact way you need.
How Client Tables Handle Big Data
With Client Tables, it’s possible for you to build views over large amounts of data and give your end users the ability to explore and summarize thousands or millions of records quickly right from the browser and PC.
With an easy-to-use design interface on the PC, you can build Client Tables to drill into detailed data, filter, pivot, and subtotal data, as well as add data markers and auto size rows and columns. Simply stated, Client Tables allow you to actually see your data in a way that helps your users make more informed decisions.
How Users Analyze the Information
Once a Client Table is displayed, users can analyze their data by filtering, drilling-down, pivoting, graphing, and more. The great thing about Client Tables is they can run from a PC and from a browser using SEQUEL Web Interface (SWI). For our example, we will use the SEQUELEX/CTVIEWL Client Table. To get started, simply select it from the SWI Explorer.
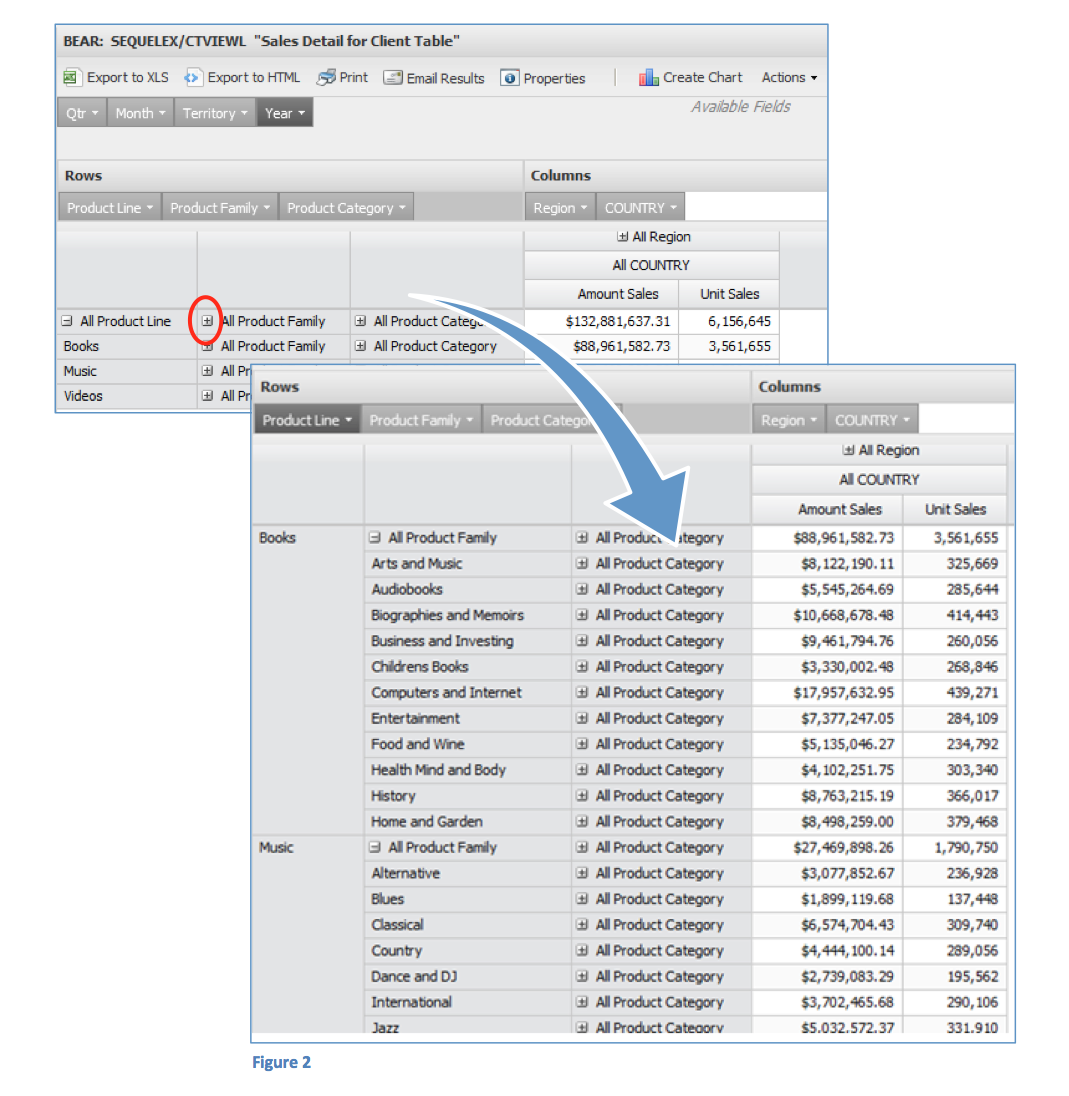
The Client Table will initially display with the data collapsed, which allows you to see the data in a summarized format. By selecting the Expand All feature, you can quickly change from a summary level to more detail (see figure 1 and 2).
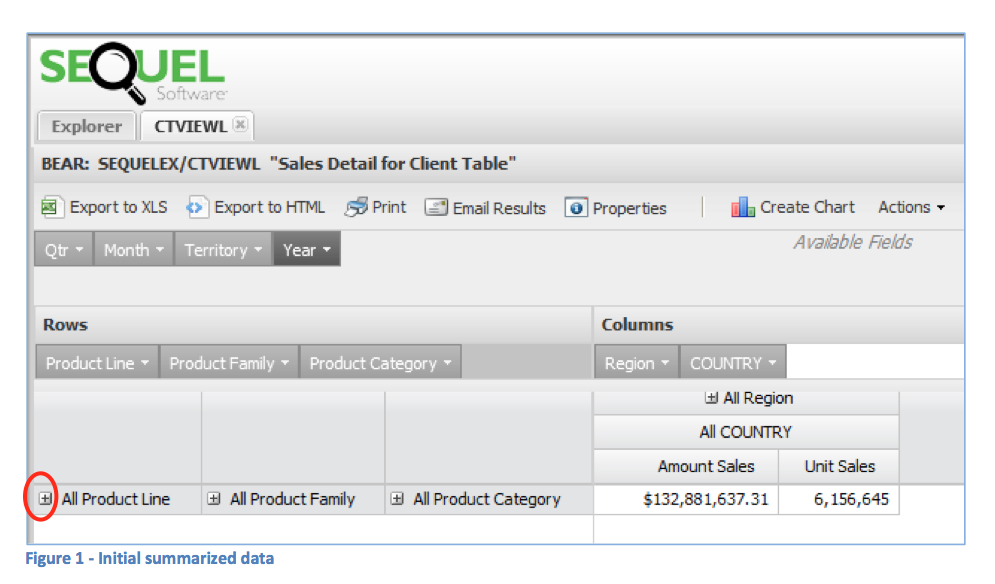
Do you need to dig deeper, beyond the first dimension? After expanding the first time (in this case we expanded the product line), click the “+” sign next to Product Family to expand further.
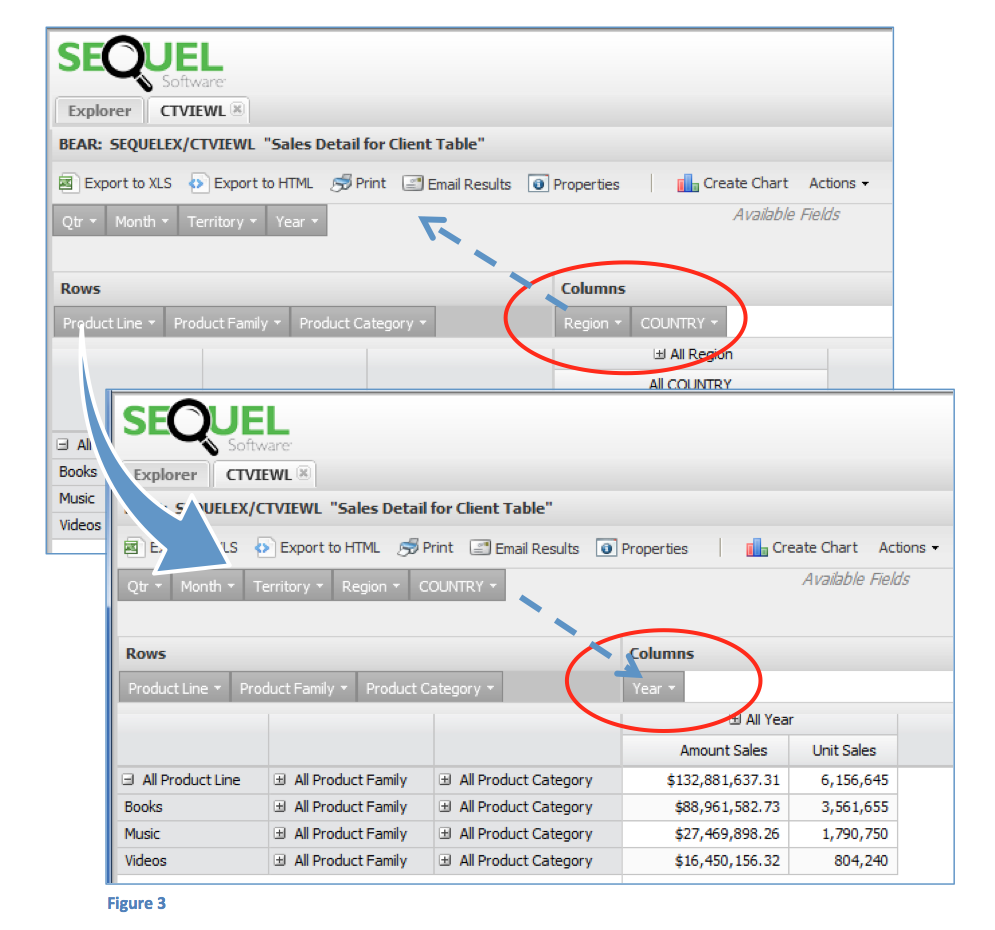
Just like a classic pivot table, you can view more results by manipulating your rows and columns. In the example, you can view the Product Line sales by Year just by clicking and dragging items to define what you’d like to see (figure 3).
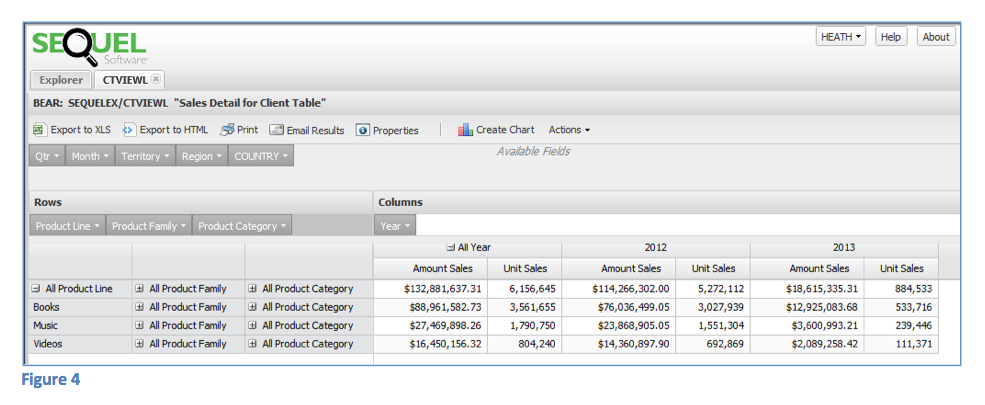
Expand or drill deeper by clicking the “+” sign next to year to see all the years (figure 4).
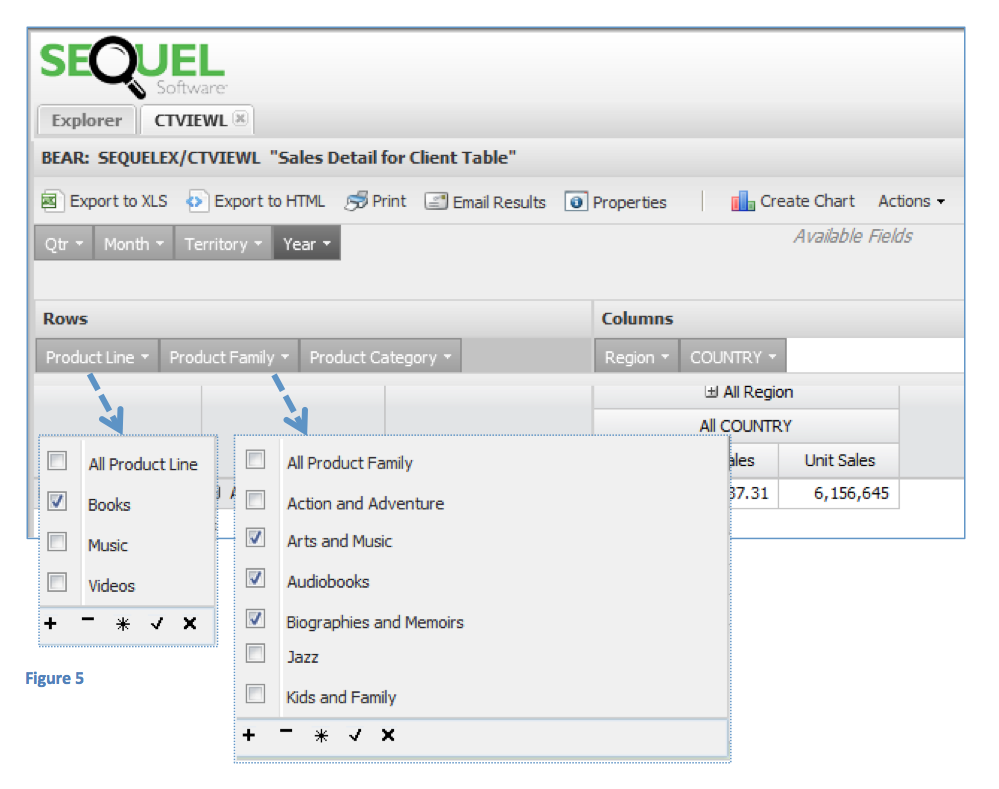
With filtering, you can control which records are included and list product lines, the product family, and/or the product category by selecting or unselecting from the detailed lists (figure 5).
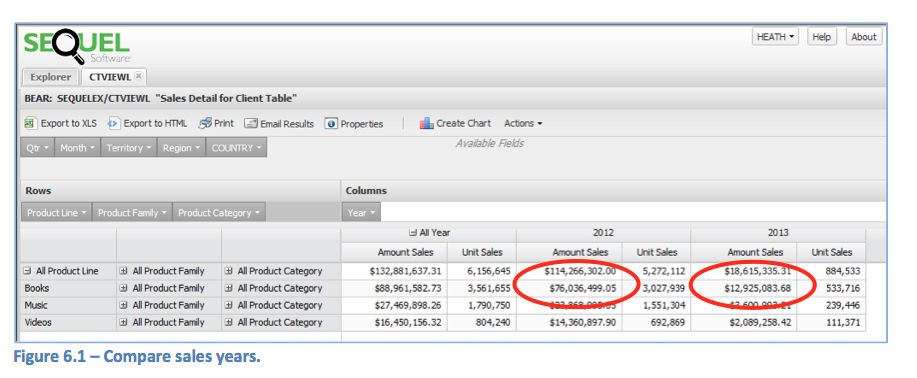
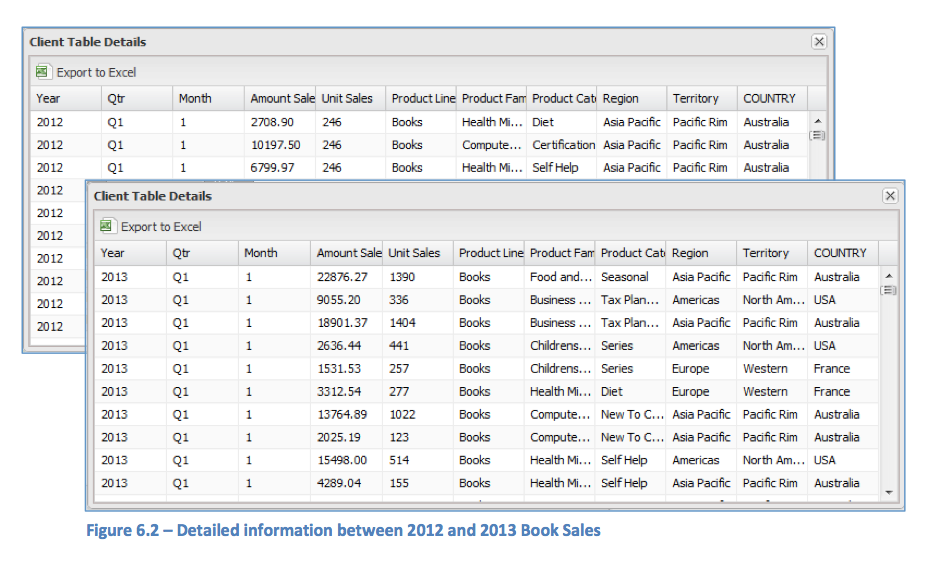
With Client Tables, you have a quick and easy way to do year-to-year comparisons of sales. To dig deeper beyond figure 6, simply double click on the cell to drill into the detailed data (figure 7).
Get the Data in the Hands of Your Expert
From a PC or a browser, Client Tables have powerful display functionality allowing you to see the information you need wherever you are. With SEQUEL Web Interface, users can access information from a Client Table right from a mobile device or tablet. Beyond just displaying information, you can graph the data and save it, export the data to excel, or share it via email. You have control; you have options!
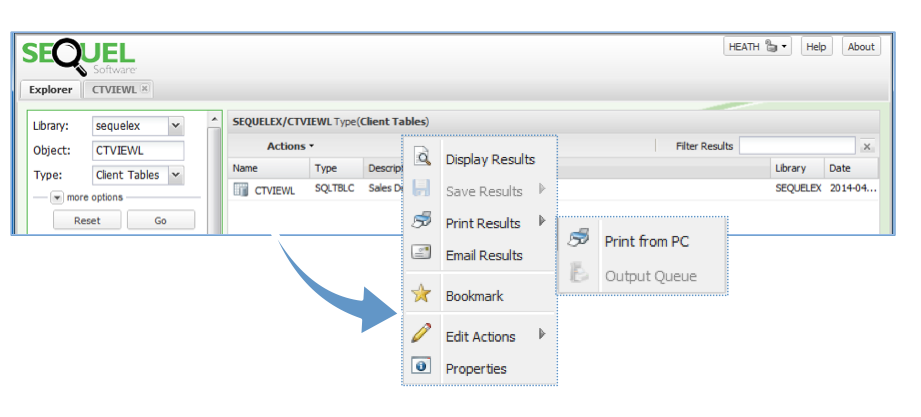
To export or share data in SEQUEL Web Interface, right-click on the object to select display, print, or email the results.
SEQUEL and SEQUEL Web Interface Gives You Options
With the combination of SEQUEL Web Interface and Client Tables, you will be able to access and analyze huge amounts of data wherever you are. From adding and taking away fields to drilling into details, Client Tables give you the power you need to see your data and make informed decisions.
Are you ready to get started? Check out our 4 Simple Steps to Building a Client table in the March 2013 edition of SEQUEL Connections. Have questions or what to give SEQUEL a try? Contact us!
Looking for more Sequel tips and tricks?
Check out the articles and forums in the Fortra Community Portal!