
It’s true. The Robot Network web user interface effectively replaces its thick client GUI. What’s the advantage? You no longer need to update separate installs of the Robot Network graphical interface on multiple PCs. Simply install the web interface on a single server and everyone gets the latest functionality on their desktop, tablet, or smartphone!
Making Setup a Cinch
All the setup features for managing Robot Network host and node systems have been incorporated into the web interface, so there’s no need to toggle back to the GUI. You can now manage the escalation of performance thresholds and exceptions, metrics retention, and collection intervals directly from the web interface. We’ve even added some options to see the latest performance metrics collected, disk status, active jobs, system information, and spooled files.
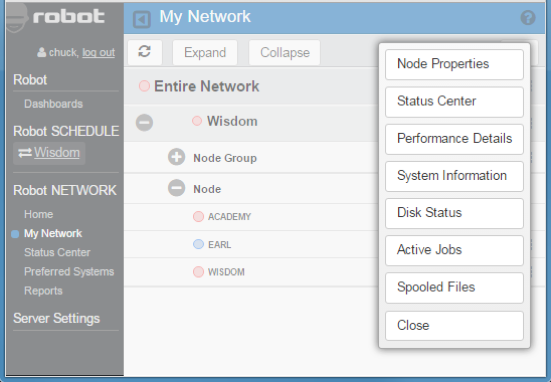
Figure 1 – Robot Network host, node, and systems management options
Drilling Down to the Details
New performance graphs in the web interface give you the ability to view and drill down into all the collected metrics for that time period. You simply hover on the graph, choose a data point for the day and time of interest (perhaps a spike), then choose either System Status, Memory Pools, or Disk Unit information.
Over 40 performance metrics are collected at a selected interval, which can be unique for each system or partition. You can use the drop-down menu at the top of the screen for the complete historical archive of collected performance metrics.
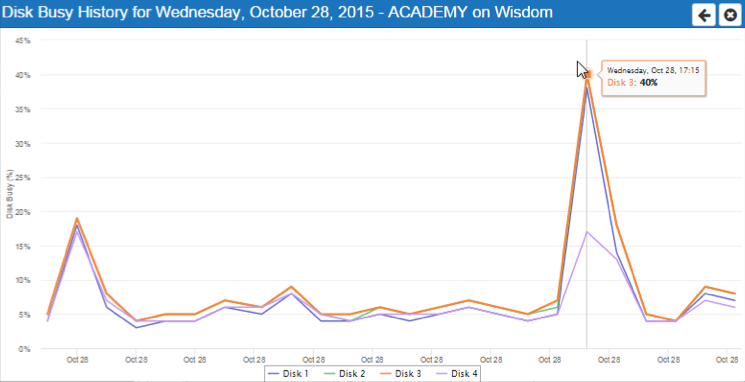
Figure 2 – Robot Network performance graph
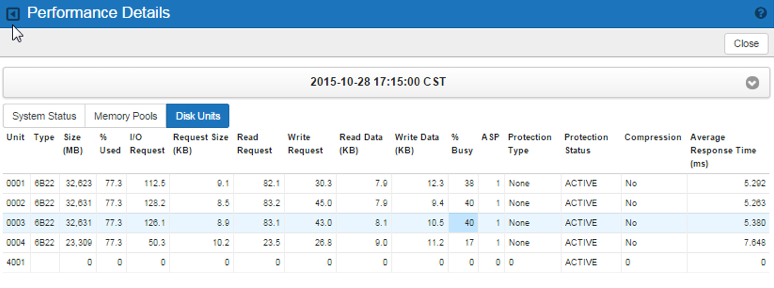
Figure 3 – Drill down into performance details
Consolidating Notifications
Robot Network is the conduit for consolidating critical notifications from all areas of your IBM i automation into a single pane of glass we call the Status Center, available in the web interface. Critical notifications from your other Robot products, including the messages that Robot Console monitors, are centralized and displayed in the Status Center as well.
You can add notes and ticket information to each escalated issue and easily search the list by product, system name, assigned to, or the full text of the issue. For example, all issues escalated from the Robot Space disk management product from any partition into Robot Network can easily be filtered for analysis.
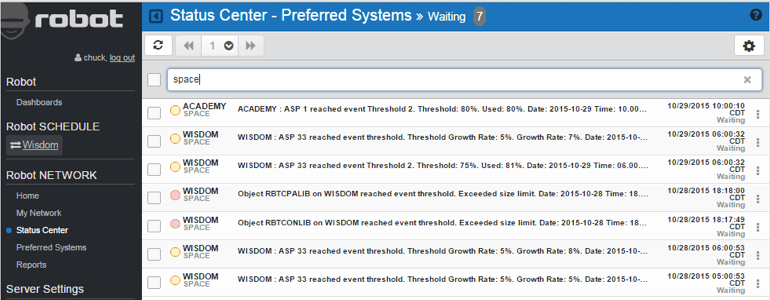
Figure 4 – Status Center filtered for Robot Space notification from Academy and Wisdom partitions
Getting System Information Fast
Need to see the status of the critical production IBM i right now? The Robot Network web interface introduces a new System Information view from your list of IBM i systems. The first view gives you a graphical summary of the outstanding issues escalated from your systems. You can also group your individual partitions into Node Groups to consolidate systems into subset groups for viewing performance and status information.
![IBM i node partitions and node groups in Robot NETWORK]](/sites/default/files/marketing-images/robot/Network/rb_rbnodepartitions.png)
Figure 5 – Network of IBM i node partitions and node groups
From this list, you can choose the system options and pick System Information. Immediately you’ll be presented with a summary of that system’s memory, disk, CPU, model, feature code, and OS level.
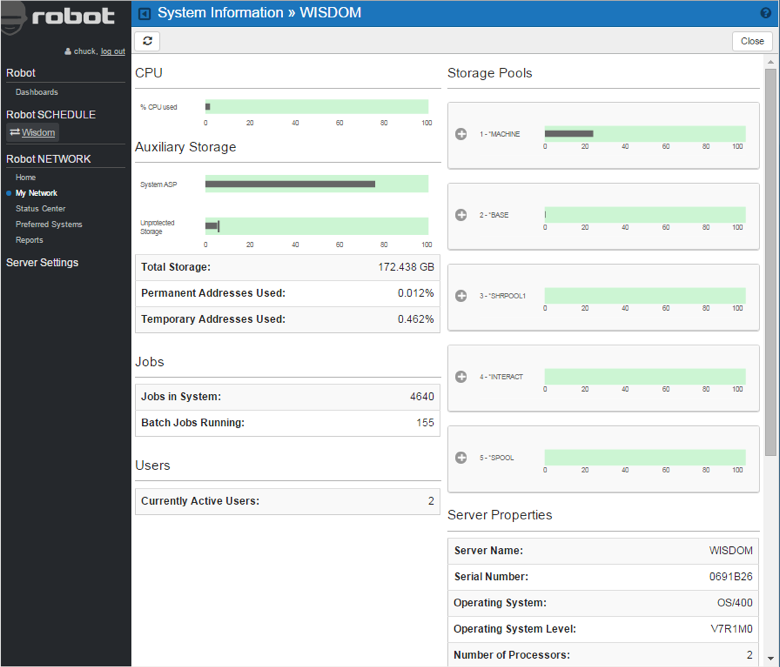
Figure 6 – System Information
Reporting Across Systems
All Robot Network reports are now included in the web interface and can be previewed and scheduled directly into Robot Schedule for automated report creation.
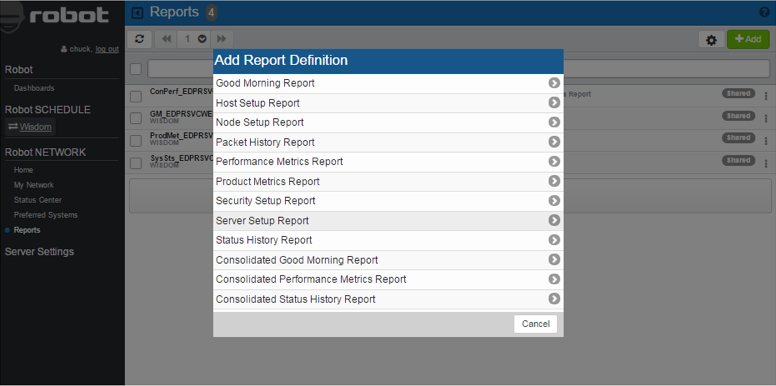
Figure 7 – Robot Network reports
Flexible parameter selection for month to date, year to date, yesterday, today, or a range of dates can be selected. You can use the Good Morning Report to report on the level of escalated activity you’ve had from your IBM i system or systems, choosing the consolidated version to include multiple systems.
Similarly, you can use the Performance Metrics Report or the consolidated version to list the details behind the performance metrics collections for system status, memory pools, or disk units.
Combining Dashboards
Perhaps the coolest part about the enhanced web interface is that you can now combine both Robot Schedule job scheduling metrics and Robot Network performance metrics into a single dashboard for a one-stop shop to view the status of your processes and system performance. These dashboards can be shared, made private, or set to be viewed by guest users who have read-only privileges.
Any of the metrics widgets can be expanded to full screen for a better view of the graph details. The widgets can optionally be set to update automatically at a frequency of your choosing and can point to your critical production system(s) as required. Dashboards will reformat themselves automatically thanks to the responsive web design.
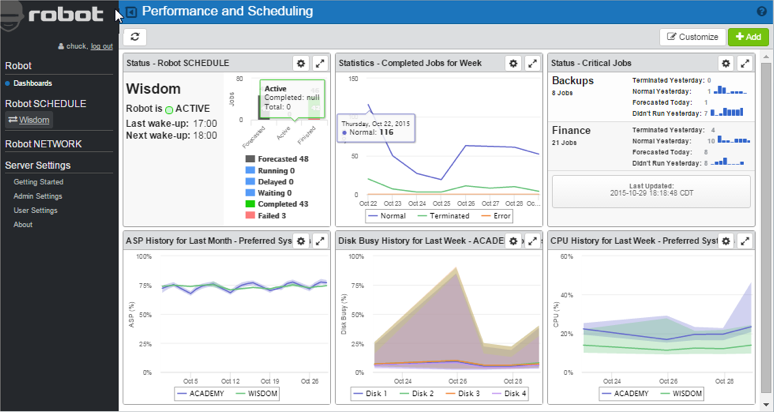
Figure 8 – Job scheduling metrics are here displayed in the top row and system performance metrics on the bottom
Dashboard graphics now show the range of the statistic for historical data as a shaded graph and the average as a solid line, as shown in the CPU History and Disk Busy History widgets.
So, if you are away from your desk and don’t want to start up your PC to check on your system, with the mobile-friendly, browser-based interface to Robot Network, you can keep your finger on the pulse of your IBM i just by putting Robot in your pocket!
Get Started
Manage your all Robot software across IBM i systems and partitions from one convenient status center. Request a demonstration today to learn more about the Robot Network web interface.