What Is Automated Analytics for Intermapper?
Automated Analytics for Intermapper is a flexible, fully automatable performance analysis and reporting solution. Automated Analytics eliminates the need to spend countless hours poring over network data to produce reliable forecasts or pinpoint valuable insights and anomalies in the data.
What Can Automated Analytics for Intermapper Be Used for?
Intermapper includes network mapping and basic reporting as standard. Automated Analytics adds additional capabilities:
- Comprehensive data analysis: Automated Analytics includes a variety of functions such as forecasting, anomaly identification, and data distribution, that can be included in reports and dashboards to get the most out of your network data. Reports can use single or multiple metrics against data from any available time interval.
- Decision support: Once the data has been analyzed and transformed into actionable information, it needs to be packaged and provided to the right stakeholders. Automated Analytics has multiple endpoints including email, file systems such as SharePoint, and its own portal. Distribution can be customized so that users only see the reports that are relevant to them and in the format that they require.
- Grouping of devices: Automated Analytics drives analysis and reporting by mapping devices into groups, such as services, applications, costs centers, line of business solutions, etc.
Keeping IT stakeholders informed: The Automated Analytics scheduling engine ensures that reports and dashboards are automatically available to the right people at the right time in the right format, including PDF, HTML, Microsoft Excel, and Microsoft Word.
Example Use Cases
Finding a Response Time Anomaly for a Group of Devices
A crucial component of maintaining consistent device performance involves identifying anomalies over time. Automated Analytics gathers historical data from a selected group of devices, graphs the data, identifies data points that vary from the performance baseline, and reports on these abnormal metrics. Administrators can then investigate the discrepancy and resolve any issues.
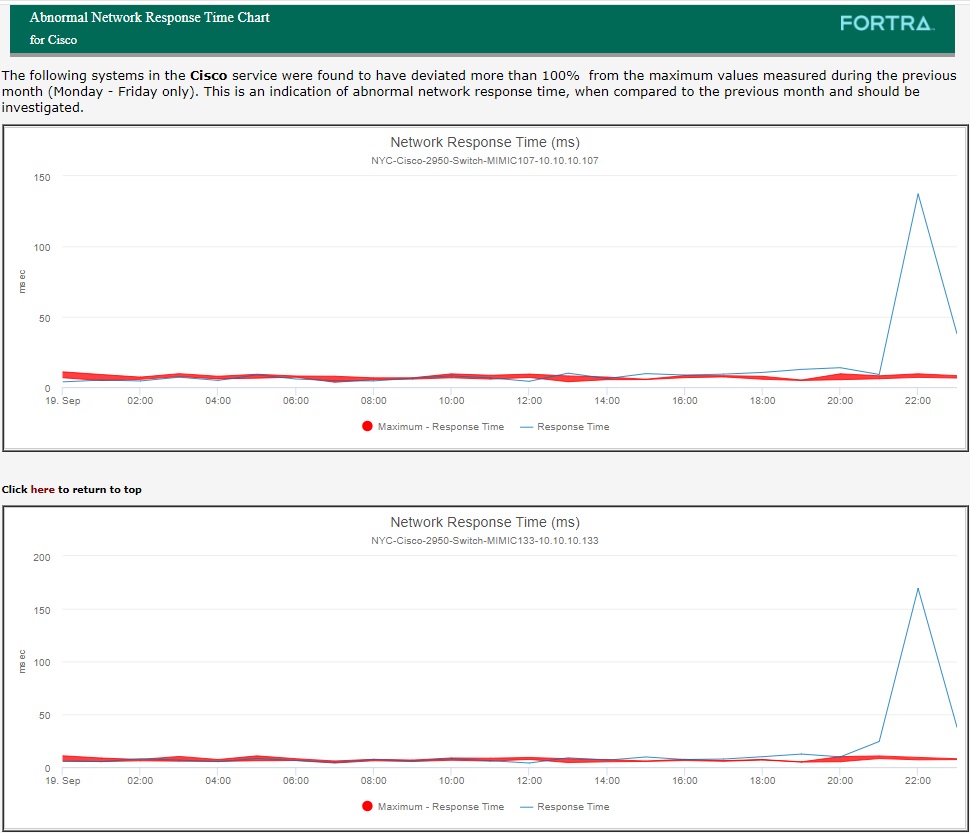
These charts indicate that the response times for a group of devices have deviated more than 100% from their historical baseline.
Providing an Overview of a Group of Devices
For a high-level snapshot of the network, administrators can create customizable dashboards for specified device groups by selecting the devices, metrics, and charts they would like to see featured.
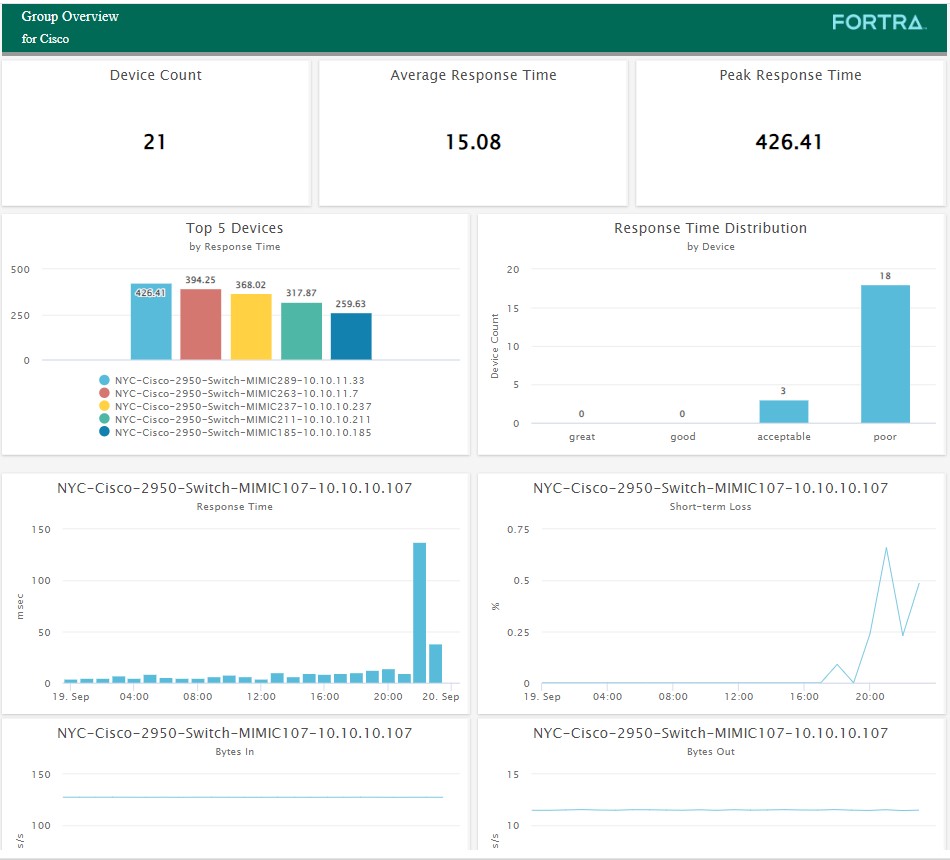
This dashboard displays key metrics for a specified group of devices. Administrators can save and reference this dashboard at any time.
Availability Percentage Uptime for a Group of Devices
Automated Analytics tracks and stores granular data on a multitude of key network metrics. For example, customers can instantly generate a report on availability percentage uptime data.
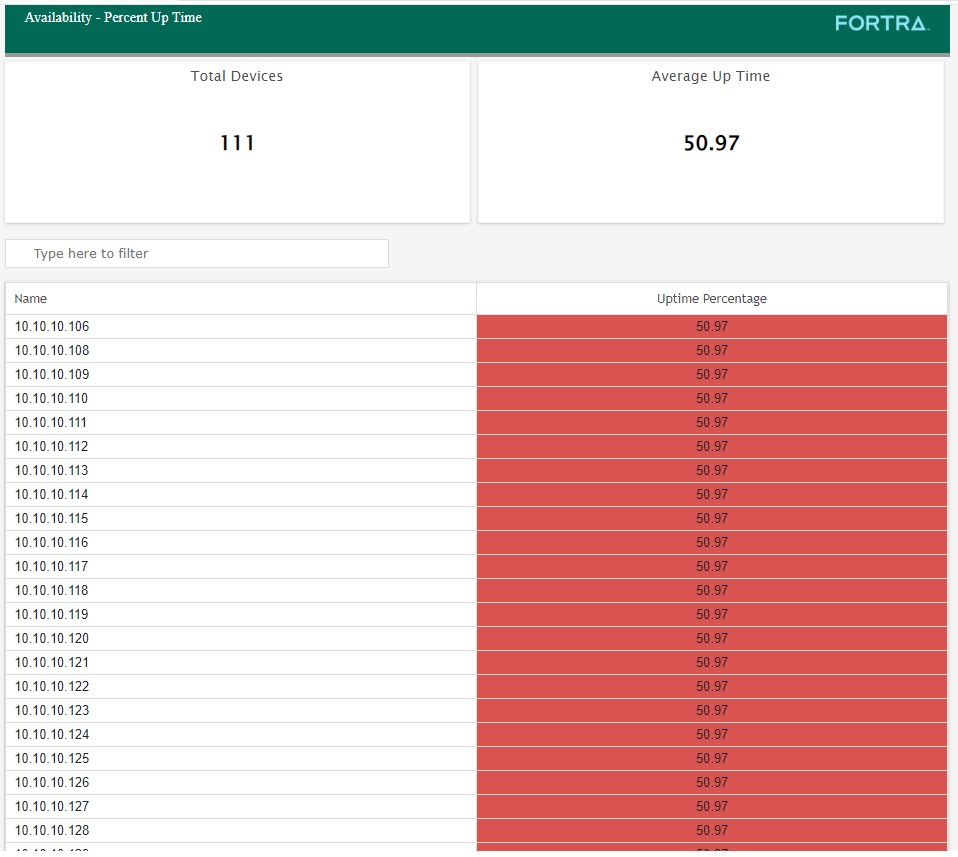
The chart above shows the average availability percentage uptime and individual metrics for a group of devices.
Automated Report Creation and Distribution
Automated Analytics makes reporting a breeze with customizable report creation, scheduling, and distribution. When scheduling reports, customers can pinpoint the device groups that the reports are running against. For example, detailed reports can be created that are based on commonalities like device types, maps, device names, etc. Reports can be generated and scheduled for automatic distribution via email, saved to the IFS, and displayed in the Reporting Portal.
Ready to Get Started with Automated Analytics for Intermapper?
Automated Analytics takes the leg work out of extracting insights from your network data. If you would like to learn more about Automated Analytics for Intermapper, please reach out to: