This is a little quiz to test your understanding of the triplet of numbers that appear in the UNIX® load average (LA) performance metric.
What is the Load Average (LA)?
In case you’ve forgotten, the following shows example output from the uptime command on a typical UNIX platform.
[pax:~]% uptime
9:40am up to 9 days, 10:36, 4 users, load average: 0.02, 0.01, 0.00
It shows the time since the system was last booted, the number of active user processes and the load average; which happens to be relatively low in this case. The three numbers (“The LA Triplets”) correspond to the load over the past 1, 5, and 15 minutes.
A detailed discussion of the load average (LA) metric, as well as the answers to this quiz, will appear in an forthcoming TeamQuest online column.
Now, try the quiz ...
Note that all the loads used in the following examples are relatively high and therefore would most likely need to be taken seriously on a real system.
If you’re having trouble deciding on the answers to any of the questions, check the visual hints given in Section 2 including a special animation in Section 2.2.
1.1 Random Samples
In each of the following samples,
| A. load average | 6.85 | 7.37 | 7.83 |
| B. load average | 8.50 | 10.93 | 8.61 |
| C. load average | 37.34 | 9.47 | 3.30 |
s the load generally:
- Increasing
- Decreasing
- Stationary
- Undecidable
1.2 Sequential Samples
Now, let’s look at some load averages monitored in sequence by sampling them over a 5-hour period (e.g., using the uptime command) at each of the times shown in the left-most column.
| 8:00am load average: | 1.21 | 0.81 | 0.13 |
| 8:10am load average: | 37.34 | 9.47 | 3.30 |
| 8:50am load average: | 19.21 | 16.02 | 7.40 |
| 9:15am load average: | 13.92 | 15.13 | 8.18 |
| 9:40am load average: | 10.51 | 13.50 | 8.47 |
| 10:30am load average: | 8.50 | 10.93 | 8.61 |
| 11:00am load average: | 8.15 | 9.84 | 8.55 |
| 11:20am load average: | 7.72 | 9.20 | 8.44 |
| 1:00pm load average: | 6.85 | 7.37 | 7.83 |
Imagine a sysadm running the uptime command at those wall-clock times.
1.2.1 Maximum?
In which LA sample does maximum load occur?:
- the LA sample taken at 9:15am
- the LA sample taken at 8:50am
- the LA sample taken at 11:00am
- the LA sample taken at 10:30am
1.2.2 Minimum?
Excluding the first LA sample at 8am,in which sample does least load occur?:
- the LA sample taken at 8:10am
- the LA sample taken at 11:20am
- the LA sample taken at 1:00pm
End of quiz.
1.3 Answers
Answers will appear in an forthcoming online column.
2. Visual Hints
The numeric triples that represent the load average metric are convenient for computers but hard on the system admin. If you’re only looking at one set of triples, it’s not too difficult. But comparing several load average samples simultaneously can soon become fatiguing.
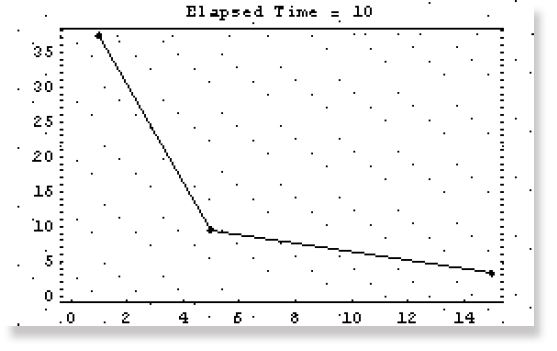
In such circumstances it is often helpful to have a visual aid. The following diagram shows the 10-minute load average in question 1.2 represented graphically.

The 3 dots correspond to the three numeric values. The y-axis shows the load values and the x-axis shows a range of time between 1 and 15 minutes. The left-most point represents the 1-minute load average, the middle point represents the 5-minute load average and the rightmost the 15-minute load average.
2.1 Sequential Triplets
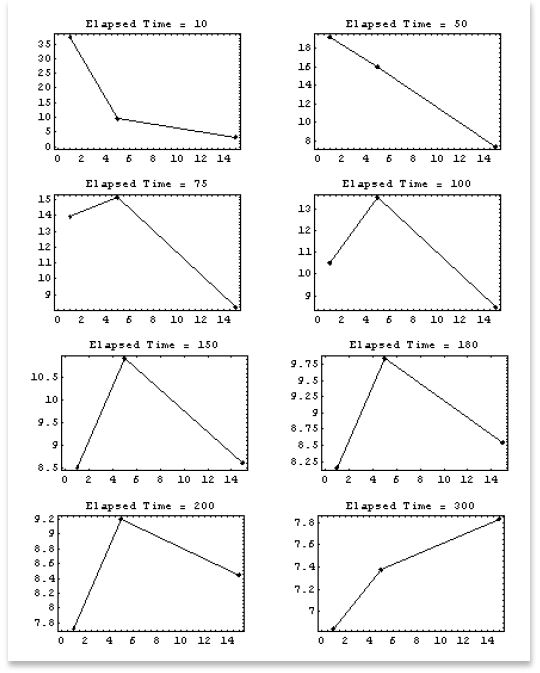
The complete sequence in question 1.2 can be represented as a collection of such visual triplets.

Get started with a capacity management practice
Learn how to do capacity management and get to know the right tools for the job.
