In this paper we present an introductory analysis of throughput scalability for update intensive workloads (such as measured by the TPC-C or TPC-W benchmarks) and how that scaling is limited by serialization effects in the software-hardware combination that comprises any platform.
Introduction
The search for parallelism in commercial processing continues apace. Software enhancements for parallelism regularly appear in each of the commercial relational database management systems (RDBMS) such as: Oracle, Sybase, DB2, MSSQL.
Hardware vendors such as Sun Microsystems offer improved efficiencies in their existing shared memory platforms while others, such as: HP, IBM/Sequent, and SGI, offer ccNUMA or Non-Uniform Memory Architectures. Windows 2000 offers its own style of cluster solution [Sportak 1997].
The underlying motivation for this trend rests on the potential economics of scale offered by efficient parallelism. In this article we present an introductory analysis of throughput scalability for update-intensive workloads (such as measured by the TPC-C or TPC-W benchmarks) and how that scaling is limited by serialization effects in the software-hardware combination that comprises any platform.
Hardware Parallelism
There are three major hardware architectures that support varying degrees of parallelism [Buyya 1999]. These are commonly denoted as follows:
- Shared Memory - Comprises a single bus between a common, shared memory and multiple processors (often with local cache memories to further improve memory latency). A variant on this theme adds a small number of buses or memory modules. For most commercial applications it is important that available processor be able to do work. These platforms are referred to as “symmetric” multiprocessing or SMP. Most multiprocessors on the market are of this type.
- Shared Disk - Here, disk storage is shared between multiple SMPs to improve availability (not necessarily performance). A common implementation involves just two SMP nodes sharing a set of dual-ported disks to remove the single point of failure.
- Shared Nothing- Typically refers to an architecture where each node possesses its own complement of memory, disk, and CPU. This is actually a misnomer. If there was truly no sharing going on, there would be no need for a high-speed network to interconnect each of the processing nodes. The intent is that the interconnect network be the least utilized subsystem. But, as we shall see, that is not written in stone! The degree of sharing between the processing nodes is also a function of the application running on them (see the section called Grains of Parallelism).
Another version of the shared-nothing architecture is NOWs (Networks of Workstations) or Peer-to-Peer file sharing. The latter is the kind of point-to-point file distribution that was being done between PCs via Web-based services such as Napster.com. In that case, the entire internet is the interconnect network. However, one needs to keep in mind that relatively little computation is done in file sharing services. The current commercial database architectures are not scalable on Peer-to-Peers platforms, so we shall not discuss them any further here.
The actual topology of the processor interconnect network varies considerably across currently available server platforms. For example. The optimal interconnect topology for OLTP or other database workloads is not probably known.
In contrast to SMP architectures where the memory bus bandwidth remains fixed as processors are added, the salient point about clusters is that shared nothing architectures add more bandwidth as more processing nodes are added to the system. This concept is shown very schematically in Figure 1.

In several cases, we have cluster vendors that originally established themselves in the scientific and engineering marketplace - which includes funding from military sources. As this funding for parallel “number crunchers” dries up, those vendors are under increasing pressure to position their platforms as “parallel” database machines for commercial applications. Capacity planners need to be aware of this syndrome and recognize that clusters which demonstrate excellent performance running the Linpack or Livermore Loops scientific benchmarks will not necessarily demonstrate comparable OLTP performance. Compared to database applications, scientific code is simpler, the working sets are much smaller, and the amount of data sharing is easier to minimize. We will formalize this point shortly.
Economies of Scale
The same commodity pressures we see shaping the open systems marketplace (i.e., proprietary systems arc ultimately too expensive when compared with open systems) will share the migration to parallel systems. In the “plug-and-play” game of open systems. the consumer can choose platforms and applications from independent vendors at competitive prices. The paradox is that coherent performance management tends to be a casualty of this migration process. Indeed, the future ain’t what it used to be!
Unlike the proprietary systems, the platform and operating system come from the hardware vendor while the RDBMS middleware and the applications software will all come from other (software) vendors. We see this effect now in the migration to client-server architectures in the database server marketplace. It is this commodity pressure that drives enterprises to adopt open systems in the first place.
Since client-server is an example of loosely coupled distributed applications, we can expect the same scenario to apply to UNIX and NT cluster migration. The net result for an enterprise is that any commercial gain due to commodity pricing can be offset by loss of control over performance management and capacity planning.
Much of the traditional mainframe approach to capacity planning are not applicable to large-scale systems because UNIX performance instrumentation on SMPs is immature and applications running clusters present a completely new set of issues. But this is not the only problem.
Even if UNIX performance instrumentation were in better shape, it cannot inform the capacity planner about performance aspects of the RDBMS. That information must be gleaned separately from statistics reported by the RDBMS. But there is no consistency across the various database vendors as to how these statistics are reported and what they contain, let alone integrating this information. A product such as TeamQuest Performance Software can help here.
Open cluster platforms use more commodity parts, e.g. the same microprocessors used in PCs and workstations. The commodity pricing of a microprocessor, however, is primarily determined by its share of the workstation or PC marketplace. The engineering requirements in that marketplace are often the converse of what is required for the large-scale database marketplace. For example, the working set of an RDBMS is much larger than the typical on-chip cache sizes provided with commodity microprocessors.
Therefore, even though the prima facie argument of a thousand (cheap) chickens versus ten (more expensive) oxen looks appealing. it is less impressive if all those chickens need to stop for frequent feeding. Microprocessor speeds are also tending to outpace the speed of commercially available memory controllers. This conflicts with the requirement for the RDBMS to access its own memory caches to service requests from database backend servers.
Arguably, for these reasons and others, the die has been cast regarding hardware technology for cluster systems. The remaining issues lie with software, generally, and in the RDBMS. In particular. How can we formalize these effects in the context of capacity planning for cluster systems?
Scaleup vs. Speedup
First, it is useful to distinguish between the terms “speedup” and “scaleup.” The former term is usually associated with a measure of parallel numerical performance, while the latter is more appropriate for transaction system workloads.
Speedup quantifies the reduction in elapsed time obtained by executing a fixed amount of work on a successively greater number of processors. This is central to the notion of why an aircraft designer might buy a supercomputer; the designer wants the same calculation done more quickly. This is not the typical reason that a capacity planner recommends the purchase of more computer equipment for the enterprise.
It means that there is not just a point of diminishing returns, rather, there is a definite ceiling on the throughput of the system!
More commonly, the enterprise needs to support more “users” (humans or other computers on the network). The capacity planner does not want the additional load to adversely impact the response times of the current user community. So, the capacity of the system must be grown. or scaled up, in proportion to the additional load.
Hence, scaleup may he defined as the ability of a greater number of processors to accommodate a proportionally greater workload in a fixed amount of time. Let us denote this scaleup capacity, C(N), where N is the processors in the system.
Optimistic Scaleup
In the ideal case, where there is no possible interference between processors trying to access a shared resource (e.g., the database buffer cache), the scaleup will be linear, i.e., throughput will increase in direct proportion to load as more processors are added. This shared nothing ideal is represented by the straight line in the Figure 2. More formally, we can write a simple equation: C(N) = N. For realistic workloads, however, this will not be the case. If the amount of serial contention for a common resource (in hardware, software, or both) is represented as a single parameter 0 < < 1, then a more realistic model of the capacity is given by:

Amdahl Serial Fraction
As N grows, the second term in the denominator also begins to grow but only slowly at first, because σ is a small number. Eventually. that term begins to subvert the otherwise linear rising function making it fall away from linearity.
The rate of divergence is completely determined by the value of σ. In keeping with the notion of serial contention. we call this parameter the “seriality” factor. Interestingly. this equation has the same form as Amdahl’s law [Amdahl 1967] but with a different interpretation [Gunther 1993].
The seriality factor can be determined by measuring only a small number of processors in the system. The simple equational model can then be used to extrapolate the scaleup for the larger system. The general behavior of this capacity model is that C(N) is a monotonically increasing function of N which approaches the asymptote 1/σ.
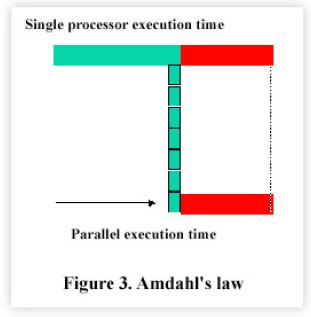
Figure 3 attempts to show this effect more intuitively. The parallel portion of the total execution time can he reduced in proportion to the number of processors applied to the workload. The serial portion, however, remains unchanged since only a single processor can perform that work. As more and more processors are added to increase the degree of parallelism, the fixed serial portion dominates the reduced execution time and is responsible for the sublinear “bending” in the scale-up curve.
The author discovered that this model. unfortunately, is generally too optimistic for open OLTP workloads. In other words, there are additional degradation effects not accounted for in this model--super-serial effects.
This result does not mean that OLTP scalability cannot follow a near linear trajectory. But typically, this will occur when the system comprises totally proprietary components, e.g. the Tandem Himalaya has shown excellent OLTP scalability on the TPC-C benchmark. In general, this will not be the case in open cluster systems. In proprietary architectures, the overall design is tailored and every “nut and bolt” can be tweaked - especially those in the software. This degree of tuning is a crucial feature for optimal performance and is not generally available in cluster systems.
Super-serial Scaleup
It turns out that the other effects are related to the overhead of maintaining data consistency in shared, updated data resources - such as one finds in OLTP workloads. For example, consider the case of an SMP where multiple copies of the same data are maintained in the hardware caches of the processors. Eventually, in an OLTP workload, one of the processors will update a particular datum. Now, when another processor comes to read that datum it will be inconsistent with its existing cached copy. Therefore, before that processor can continue execution it must first fetch the updated value into its cache. This additional time spent fetching exacerbates the transaction latency and results in even more dramatic performance degradation. See Fig. 4.
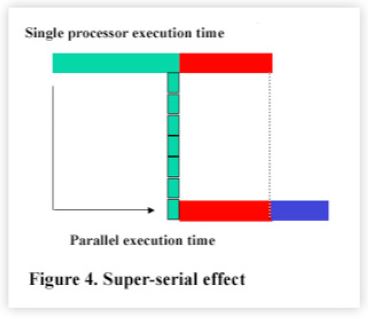
For parallel systems, any overhead for data consistency in multiple RDBMS caches will induce a similar effect. A more accurate model that accounts for this effect was discovered by the author. The optimistic model is corrected to include an additional term in the denominator giving:

Now, there are three terms in the denominator. We refer to these as the “Three C’s” denoting: Concurrency. Contention, and Coherency. There are several important things to note about this modified model. The characteristic of this equation for increasing values of λ (downward trend) is shown in Figure 5. Note first, that the third term in the denominator depends on the existence of seriality contention. If there is no contention for a common resource there can be no possible coherency effects. Hence, we call λ the super-seriality factor.
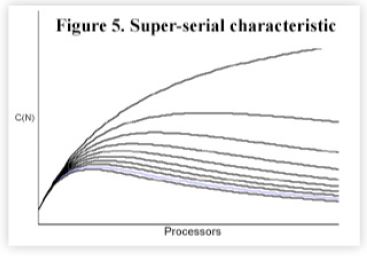
Second, because the third term grows quadratically in the number of processors, it induces a MAXIMUM in the scalability curve. This is very different from the optimistic model discussed earlier. It means that there is not just a point of diminishing returns, rather. there is a definite ceiling on the throughput of the system! Note also that the ceiling occurs at smaller and smaller processor configurations as λ gets bigger.
On the other hand, as λ → σ we recover the optimistic model, as expected. A more detailed account of these models is given in [Gunther 1993].
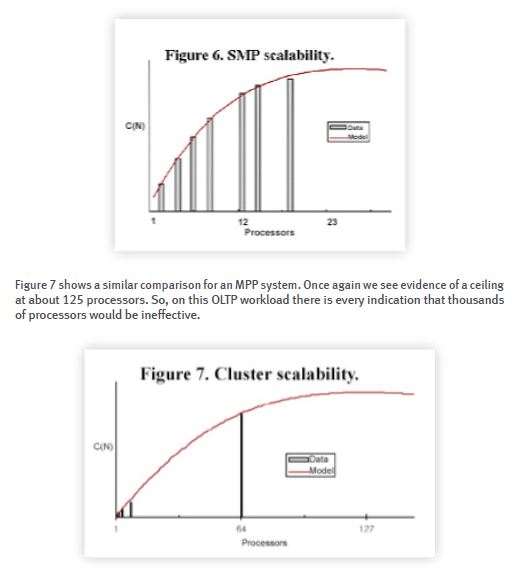
Figure 6 shows a comparison of measured OLTP benchmark data with the super-serial model described above. The model shows good agreement with the data and we note the appearance of a ceiling in C(N) at about 25 processors.
Comparative Scalability
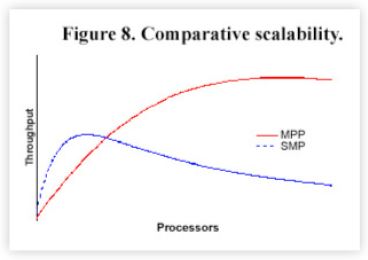
To meet pricing constraints in the cluster market it may turn out that the available processing nodes will not always he the fastest available; some SMPs may have fewer but more expensive processors.
As Figure 8 reveals, the SMP may have superior throughput at a smaller number of processors but the MPP may offer better growth characteristics - up to any ceiling, that might be present.
Summary
There are many myths about the performance gains offered by clusters. From the above discussion, you should now be in a better position to assess OLTP scalability. The key points to keep in mind are:
- Do not accept statements like “99% scalable”. Remember the “Three C’s” concurrency, contention. and coherency. Throughput scalability is not a number, it is a function of the number of processing nodes for a specific set of workload characteristics. Technically, the parameters s and 1 in the scaling equation presented here reflect that dependency.
- The scaling parameters can be determined by measurements on a small configuration parallel platform. Those data should he used to plot C(N) against N.
- Cluster architectures are physically more scalable than SMP architectures because adding processors to an clusters adds more aggregate interconnect bandwidth whereas the interconnect bandwidth remains fixed in SMP. But software performance (or rather, lack or it) may defeat the available bandwidth.
- Tools to support dynamic tuning and data partitioning are also very important. Remember that OLTP performance on a parallel platform will he extremely sensitive to data layout.
- Do not accept statements like “Scalable to thousands of processors”. From the above discussion you should now be able to objectively evaluate claims about how many processors can be plugged together electrically from the capacity ceiling that might be imposed by the software components.
The reader who is interested pursuing applications of clusters can find a thorough account in [Pfister 1998].
Grains of Parallelism
Massively parallel processors are the kind of clustered systems that have been used typically for scientific computations e.g., seismology and aerodynamics. Without intending to oversimplify the complexity of these problems and the ingenious algorithms designed to solve them, the central idea is to detect code structures, such as iterations of a loop. Then, instead of executing the loop in sequence, the iterations are divided up across a large number of processors to he executed simultaneously. This is the basis of the speedup metric referred to in the main text. At each step during parallel execution, every processor in the parallel cluster complex is executing an identical instruction, but acting on different data. This instruction level of parallelism is the strongest form and is, sometimes called fine-grain parallelism. Since there is only one program being executed, however, the workload is single-threaded or corresponds to a single-user.
Symmetric multiprocessors (SMPs), on the other hand, are more efficient at handling multiple users or multithreaded workloads. In that case. each processor is typically executing the same kind of code but at any point in time will he executing a different instruction. This level of parallelism, sometimes called course grain, is the weakest form of parallelism. SMPs can he used for fine-grain computations, but a disadvantage comes from having only a few processors rather than a few thousand across which to divide the workload.
These two examples represent the ends of a spectrum of parallelism [Flynn 1995]. Database workloads fall somewhere in the middle of this spectrum. They are definitely multi-user and therefore are certainly not fine-grain, but they can have a higher degree of parallelism than purely coarse-grain workloads. The degree of parallelism is determined by a number of factors such as: data partitioning, e.g., hash or range partitioning; and the degree of data flow that can he expressed in the database access language. The language, SQL (Standard Query Language) has properties that make it suitable for achieving high degrees of parallelism in the context of relational databases. Hence, it is one of the driving influences behind the re-emergence of parallelism in the context of large-scale database systems.
References
Amdahl, G., 1967. “Validity of the Single-Processor Approach to Achieving Large-Scale Computer Capabilities,” Proceedings of AFIPS, p.483. April.
Buyya, R. (Editor), 1999. High Performance Cluster Computing: Architectures and Systems, Volume 1, Prentice-Hall.
Flynn, M. J., 1995. Computer Architecture: Pipelined and Parallel Processor Design, Jones and Bartlett Pub.
Gunther, N. J., 1993. “A Simple Capacity Model for Massively Parallel Transaction Systems.” Proceedings of CMG Conference, San Diego, California, December.
Gunther, N. J., 2000. The Practical Performance Analyst, iUniverse.com Inc.
Pfister, G. F., 1998. In Search of Clusters, Prentice-Hall (2nd. Edition).
Sportak, M. A., 1997. Windows NT Clustering Blueprints, Sams Pub.
Get started with a capacity management practice
Learn how to do capacity management and get to know the right tools for the job.
