Capacity management, considered by top analyst firms to be an essential process in any large IT organization, is often so complex that in today’s accelerated business world it cannot be effectively implemented. Changing priorities, increasing complexity and scalable cloud infrastructure have made traditional models for capacity management less relevant. A new paradigm for capacity management is emerging, aided by new technologies and driven by innovative IT leaders. This new paradigm frames IT resource use in terms that are meaningful to the business, using automation and analytics to manage complexity and reduce manual effort.
This paper discusses how the complex monitoring, analysis and prediction involved in capacity management can be reduced to one metric for service health (current performance) and one metric for service risk (future performance), making this process more manageable and transparent to all stakeholders.

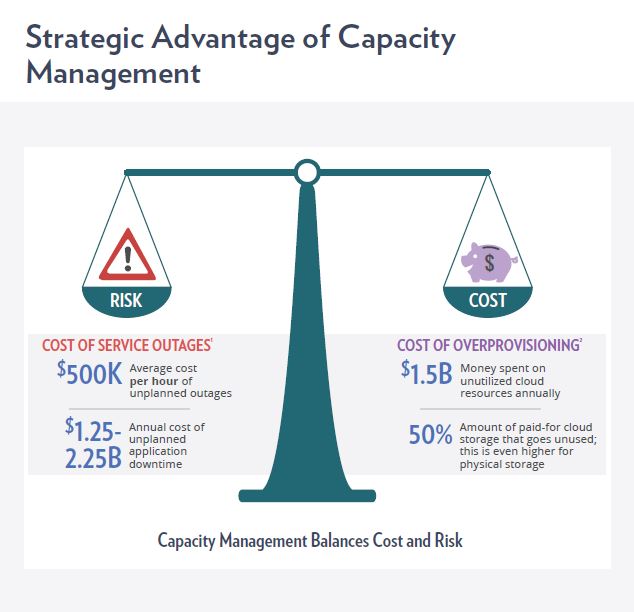
In a simplified sense, IT capacity management is the art of balancing the cost and performance of business services, where infrastructure allocation and configuration is the fulcrum. If your infrastructure is poorly configured or insufficient to support demand, long response times and outages can occur, costing the business millions. Think Black Friday retail disasters.
A typical method of avoiding such occurrences is to over-provision the infrastructure, i.e. estimate what is needed and double it. It is estimated that as much as 50% of cloud infrastructure goes unused, and even more in physical storage. That over-provisioning wastes a lot of money in hardware, software licenses, and administration costs. The trick is to rightsize your infrastructure to meet current demand and know exactly when, where, and how much additional capacity you will need. If it were only that simple.
To effectively optimize business services, the capacity management process is made up of four primary steps:
- Data Collection and Management. Collect performance data that is both deep in detail and wide in context for each application, service, and system in your environment.
- Data Analysis. Analyze data to identify the health of services, potential performance issues, and the root causes of these issues so you can resolve them.
- Prediction. Accurately predict when and where resource shortfalls will occur, so they can be avoided.
- Presentation of Actionable Information. Provide various stakeholders – IT analysts, service managers, and business leaders – information they need to make decisions.
What makes this so challenging is that IT environments are in constant flux, with dynamic technology, changing business needs, and demand growth all adding to the complexity. Time is always of the essence with performance issues, yet IT staff is spread across a variety of tasks and projects, reducing the time dedicated to ensuring service delivery. Finally, capacity management expertise is increasingly scarce.
Research In Action, a leading analyst firm predicts that by 2020, the availability of capacity and performance management skills will be a major constraint or risk to growth for 75% of enterprises.
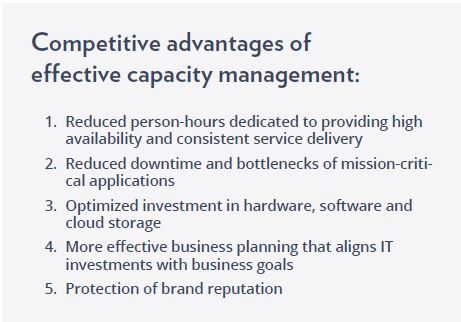
Despite, or perhaps because of, these challenges, many technology leaders believe that capacity management is a competitive advantage, and will be even more so in the coming years. Research In Action predicts that by 2020, 35% of enterprises will use capacity management tools to gain a competitive advantage (up from 20% today).

Managing Complexity with Automation

To understand this approach, let’s explore each of the core processes outlined earlier:
- Data Collection and Management
- Data Analysis
- Prediction
- Presentation of actionable information
Data Collection
Performance data must be collected at fine enough levels of granularity to match business transaction needs. Real-time trading and online shopping demand much finer levels of granularity than does batch processing, for example. Keep in mind that the collection tool you use has to provide detailed, timely data in an automated and highly-scalable way to ensure the success of your project.
Data Analysis
Traditionally, this analysis is performed by a capacity management expert reviewing the data “manually” with simple tools such as spreadsheets or by building and maintaining customized tools and queries. This type of manual analysis takes a great deal of time and expertise, using resources already stretched thin in many organizations. Automation is an answer to that, though fewer viable solutions exist in this area. Historically many of these “automated” solutions still required a lot of time to setup and fell short in terms of delivering useful information. However, technology is available today to solve the analysis problem in much more practical and effective way.
Prediction
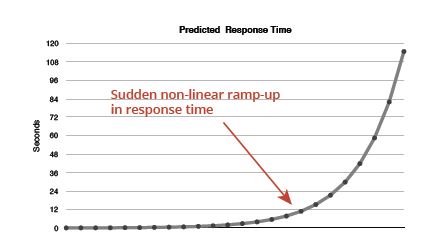
To predict performance with great accuracy, we need to recognize that computer systems do not behave in a linear fashion. If they did, then prediction would be as simple as linear trending. The reality is that queuing occurs. Queuing is when a CPU, controller, or other device has more work coming in than it can perform. Services then have to wait in a queue, much like waiting in line to checkout at a store. When there is little or no queuing, response time increases proportional to the work that gets added, until BAM! You add a little more work and some application or infrastructure now has more work than it can handle. Queuing begins to occur and suddenly the delay is huge. This is what’s called the dreaded knee in the curve, after which response time increases exponentially – the wait time is longer than the work time, and response suffers immensely.

Too often, IT assumes the delays will always be linear until SURPRISE, and they’re in a mad scramble to fix it while finger-pointing ensues.
To avoid the knee, many IT orgs follow the strategy of never letting systems get busy enough to be even remotely close to it, which means over-provisioning – safety through waste. They pay (a lot) to move the knee far to the right, then cross their fingers that they never hit it.
You have to know where the knee really is to avoid it without overprovisioning, which requires an understanding of how IT componentry interacts to perform work. A variety of techniques are used to predict performance to varying degrees of accuracy, from Excel spreadsheets to linear trending, to simulation modeling, to analytic modeling. Until recently, however, these solutions have required significant knowledge, expertise, and time. Thankfully, now it is possible to get predictions automatically in an extremely timely manner.
Presentation of Actionable Information
The result of effective execution of the three areas described above should be actionable information and transparent reporting. Since IT decisions usually have implications for the entire business, this information must also be presented in a manner that makes sense to non-IT stakeholders (for example, speaking in terms of business metrics such as sales, SLAs or uptime, rather than IT metrics such as memory or I/O. It is not uncommon for IT departments to spend hundreds or thousands of hours creating reports for various stakeholders. Where possible, reporting tasks should also be automated, freeing IT staff to focus on proactive problem-solving and innovation.
A New Paradigm

Not anymore. A new paradigm is sweeping the industry. This new paradigm uses automated health and risk scores to identify current and future performance, as well as the time frame and severity of future issues. That’s a game-changer that saves time and requires much less expertise, making capacity management simpler and more accessible to all IT organizations.
To calculate simple, easy to understand health and risk scores for each service, complex algorithms run behind-the-scenes. Watchlists can be defined to focus attention on the services for which you are responsible and easily identify where action needs to be taken, whether it be resolving a current issue or scaling capacity to avoid a future problem. No longer do you have to spend countless hours poring over mountains of data. The automated algorithms do it for you.
Why Health and Risk?
Health and risk scores address the two main functional areas within the capacity management process:
-
Performance management - identifying and resolving performance issues that result in slow application response times and service outages (Health)
-
Capacity planning - predicting when capacity upgrades or additional infrastructure will be needed to avoid poor service performance or outages (Risk)
How are health and risk scores calculated?
Health Scores
Health scores are calculated by looking deep into each system that comprises a service. Analytic queuing network models are used to calculate how well the actual CPU and I/O performance compares with each system’s theoretical optimal performance. Memory is evaluated based on current utilization levels and by looking for any deviation from normal activity levels for memory management. Disk space usage is evaluated by checking current available capacity and historical patterns of behavior. The results of the analytics are combined and normalized to create an easy to interpret health score that ranges from 0 to 100, with 0-44 indicating poor health, 45-54 indicating a warning, and 55-100 indicating good health.
Risk Scores
Risk scores are determined by running capacity planning algorithms to predict how services will perform in the future. The capacity planning algorithms predict the impact of the service growth rate on the systems that comprise the service.
Analytic queuing network models are used to calculate future CPU and disk I/O performance to compare with the system’s theoretical optimal performance. The models generate a series of predictions that account for the non-linear behavior inherent within computing systems that we discussed earlier.
Disk space usage is predicted by evaluating the pattern of activity and projecting out through the end of the prediction period. Based on these calculations, a risk score is generated to represent the severity of the risk expected over the prediction period. The risk score is normalized to a range of 0 to 100 to represent the amount of risk, with 0-44 indicating low risk, 45-54 indicating a warning, and 55-100 indicating high risk. Along with the risk score, the date at which poor performance or an outage is expected to occur is calculated.
Days to risk is calculated by looking for both one-time events and cyclical behaviors in the prediction results to forecast when the risk is expected to occur.
Simplicity Is Our Friend
With all of the work occurring automatically behind-the-scenes, capacity management is much simpler and more accessible to all IT organizations. Data scientists are no longer required, hours of staff time is saved, and predictions no longer require a rocket scientist. IT staff and service managers can look at single indicators for health and risk and in a second know where to focus attention.
Accuracy Matters
The accuracy of the algorithms and calculations are hugely important. So how accurate are they?
-
For CPU and I/O activity, by far the most accurate determinations of health and risk use analytic queuing network models.
-
For disk space and memory, intelligent algorithms evaluate patterns of utilization and subsystem activity to accurately interpret current, and predict future, utilization.
All of the methods adapt well to workload, configuration, and other environment changes. Using these methods with sophisticated algorithms, the final result is the most accurate health and risk calculations available in the industry, typically 95% accurate.
Evaluating Your Options

For determining the health of IT and business services, the following methods are generally implemented, with the starred item representing the method applied in the new paradigm:
- Standard threshold comparison
- Enhanced threshold comparison
- Event detection
- Variation from normal
- Allocation comparison
- Queuing theory
For determining the risk of IT and business services, the following methods are generally implemented, with the starred item representing the method applied in the new paradigm:
- Linear trending
- Enhanced trending
- Event projection
- Allocation projection
- Queuing theory
Options such as standard threshold comparison and event detection benefit from being easier to set up, but provide significantly less accuracy. Allocation comparison and projection are suitable for virtual environments, but lack the ability to drive resource efficiency, as they take into account what is allocated versus what is used. Queuing theory requires smart configuration and granular data, but provides significantly more accurate results in determining service health and risk.
In selecting an enterprise capacity management solution, you should consider these factors:
- Number of physical and virtual servers in your environment
- Number of services managed by the IT organization
- Estimated investment in infrastructure over next 3 years
- Extent to which current infrastructure is over-provisioned
- Potential cost of a critical service outage
These factors will underpin the potential return on an investment in capacity management and will help determine the type of solution you should pursue.
Mitigate Risk Today
Meet SLAs, prevent outages, and protect your organization—without overextending your IT team. Trust a risk mitigation and capacity planning tool to keep your IT organization healthy and risk-free. Find out how. Request access to the sandbox to try it free for 30 days!