TeamQuest (now Vityl Capacity Management) provides unintrusive mechanisms for instrumenting
applications and analyzing application performance. Neil Gunther describes how to use
those mechanisms.
TeamQuest Performance Software is a family of cooperative products that enable enterprise-wide management of computing resources, keeping systems running at optimum levels. The foundation of the TeamQuest Performance Software family is TeamQuest Performance Framework (Framework). TeamQuest Framework is not a systems management behemoth like CA Unicenter and its ilk. TeamQuest Framework is a lightweight integrated set of agents that collect performance data, store it in a TeamQuest performance database, and distribute information to the actual TeamQuest Performance Software products. It is not sold separately, and is bundled with the products in the TeamQuest Performance Software family.
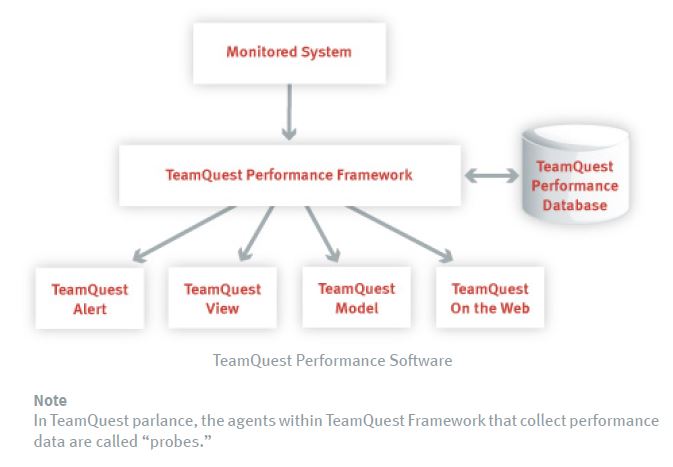
Framework has probes (agents) that automatically collect system level performance data such as CPU utilization, network packet rates, memory consumption, etc. This data is sufficient for many types of performance analysis, but sometimes it is essential to have additional performance data from applications that are using these system resources. In many products this is not possible, or if it is possible it must be done in a very intrusive way that necessitates recompiling the application with new instrumentation points. TeamQuest Performance Software, on the other hand, provides unintrusive mechanisms for instrumenting applications and analyzing application performance along with system-level or even multi-system performance data.
User probe or table probe?
TeamQuest Performance Framework provides a very convenient mechanism for incorporating application performance data into the TeamQuest performance database. TeamQuest calls the mechanism for collecting application performance data a User Data Probe. There are two types of User Data Probes: table probes and user probes. The difference between these two probe types can be summarized in the following way.
- User Probe: Used when application data is sampled.
- Table Probe: Used when application data is event-driven.
In other words, you need to reflect first on the type of data you intend to collect and then write your probe accordingly. Here is a quick checklist to help you decide which probe type to use:
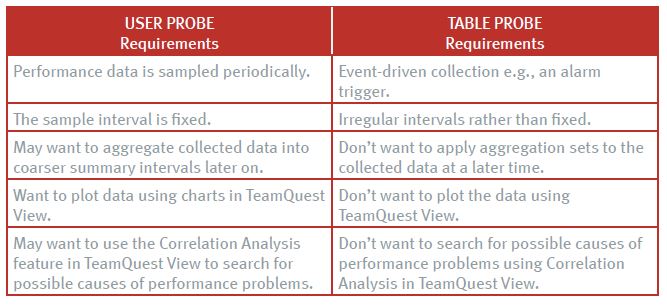
In most cases, you will want to write a user probe to collect application performance data. Let’s quickly review what a typical simple user probe looks like in TeamQuest Performance Framework 7.2 (or 8).
Sample User Probe
The following script provides an example of a simple user probe that sends the number of logins to a performance database.

This user probe is very simple in that it really only collects login data. We could have been even more simplistic, because it is not necessary to provide the date and time as we have in this example. TeamQuest can store the date and time automatically, but due to buffering delays that “automatic” date and time may not be exactly in sync with the sample being taken. So providing it as we have in the example is best. Note that the format of the date here was chosen specifically for compatibility with the requirements of TeamQuest Performance Software. In a subsequent section of this note, we’ll see how to modify this shell script to incorporate application performance data.
Note
It is generally a good idea to create a private TeamQuest performance database in which to deposit user probe data until you finally decide what you want to do with it. This approach makes it easier to delete the database when you are debugging the probe and also prevents automatic aggregation (that you may not want). You can still merge the probe data with the system database later and thereby have it automatically aggregated.

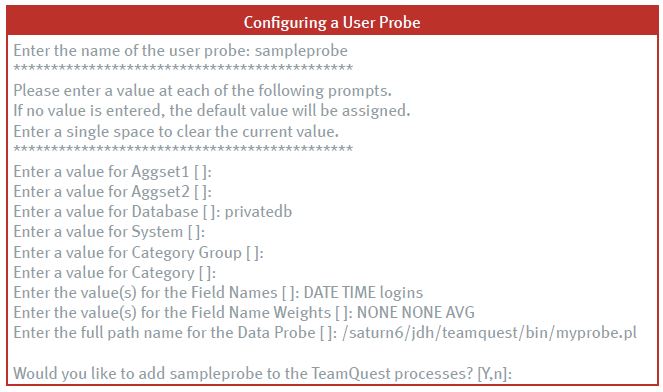
Before our sample probe can be put into operation, we need to configure it using the setup utility in the TeamQuest etc directory. Select the “Configure optional programs” followed by “Configure user-defined probes” followed by “Create or modify a user probe for performance data.” You will then be presented with the following questions:
Note
To be safe, make sure you use the full path name when giving the name of your user probe script, and use full path names for files referenced within your script. Otherwise, you may accidentally reference files in unintended directories when TeamQuest executes your probe.
After running setup, check to see that your probe is running as a process with the name that you gave it, “sampleprobe” in this case. If it is not running, to locate the cause of the problem, check the corresponding log file in the log directory under your TeamQuest directory. In this case the log would be in TQDIR/log/sampleprobe.log.
User Probe Data Format Model
Before we present an example of how user probes are set up to capture and incorporate application data into the TeamQuest performance database it is important to understand the data formatting model that is assumed for a user probe.
Here is a typical window that you might see in TeamQuest View. It shows the number of TCP connections in a histogram or Cluster Bar format.
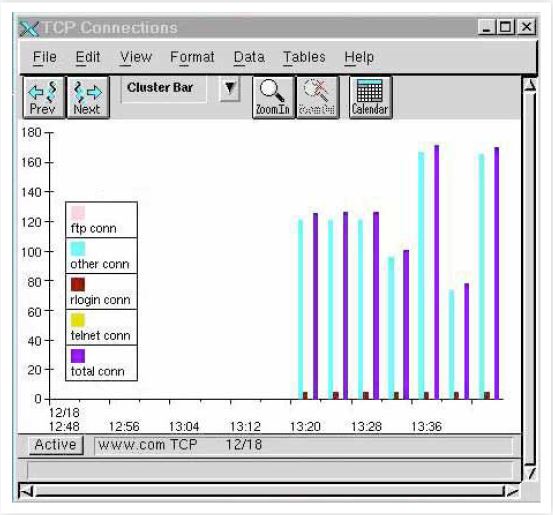
There are many TeamQuest View formats to choose from but they all presuppose that the performance data is stored as X-Y pairs. These X-Y pairs correspond to the “tops” of the Cluster Bars. The window above actually shows a “family” of X-Y pairs corresponding to ftp, telnet, rlogins, etc. depicted in different colors.
In the same way, all user probe data must be delivered to the performance database as X-Y pairs. To clarify, think of the X-Y pairs as a set of points joined by an imaginary dotted line to indicate that the X-Y pairs belong to the same family of points. This example shows the number of logins measured every 30 minutes.
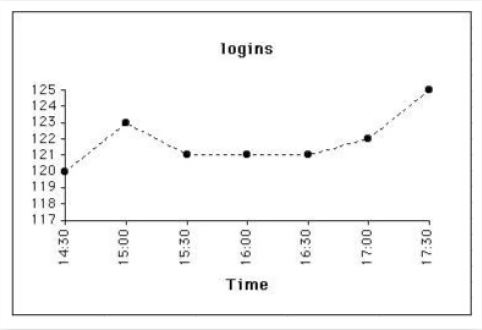
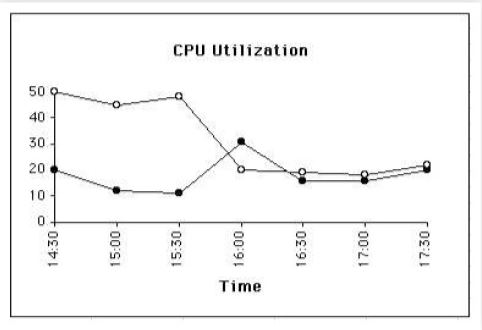
More specifically, the X-Y pairs are actually time-Y pairs (or t-Ypairs). The X-axis always represents time in TeamQuest View. The Y-axis represents whatever data has been measured. If we measured CPU utilization as %system and %user every 30 minutes we would then expect to see a TeamQuest View chart with two curves (Line mode).
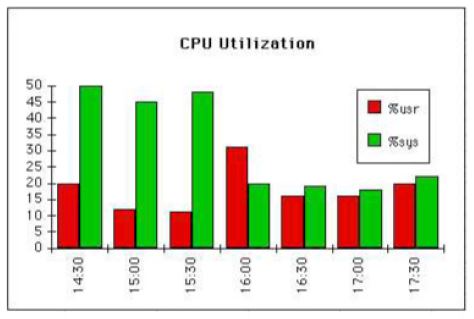
We could also represent the CPU utilization data in a Cluster Bar format and then it would look like the previous TeamQuest View for TCP connections.
This is an important principle about user probe data formatting.
Data Formatting Principle
User Probe data must be formatted as Time-Yaxis pairs.
This principle is very important to keep in mind when constructing a user probe because it will permit you to examine the data in TeamQuest View using precisely the same tools you use to examine default system level data.
Example Application Probe
As an example of how to implement an unintrusive application probe, we suppose you can write a benchmark to run your application in the production environment to measure some aspect of the application’s performance e.g., response time. This is a very common practice in performance testing and analysis. In addition, assume that the benchmark writes the measured performance data to a log file.
In this scenario, there are four major components:
- the application benchmark program
- the benchmark log file of performance data
- the TeamQuest application probe
- the TeamQuest performance database
The Application Probe can be set up to perform the following sequence:
- Run the benchmark program
- Read the benchmark log file
- Format the benchmark data as time-Y database pairs
Depending on the benchmark and the platform, it may be possible to eliminate the logging and formatting functions and output the benchmark timings directly. For example, on Unix platforms it is possible to measure various aspects of an application using the time command. If you had an Oracle query within a script called query.pl, you could measure the system resources required by the query by running query.pl using time.
Here is an example script that performs an Oracle query:

The actual SQL commands for this example are pretty simple. They are contained within a file called bench.sql:

To measure the wall clock time required to execute the query, simply run query.pl using the time command:
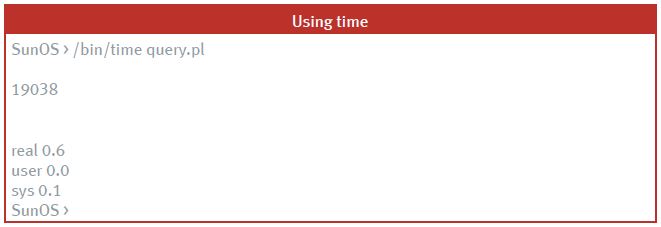
In the example, above, the number, 19038, is the result produced by the query operation, the rest of the output is from time. The first number from time is a measure of the wall clock time required to run the query. This is the number you might want to use to measure the response time of the query operation.
To create an application probe that periodically checks the response time of our Oracle query, we need a script that will produce the date, time, and just the wall clock value produced by time. Here is an example:

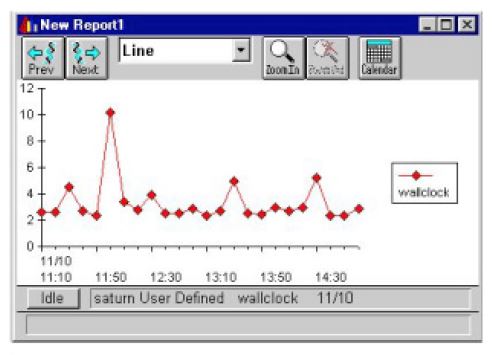
To put our application probe into operation, we need only run “setup” in a manner very similar to what we did for our Sample User Probe earlier. (See “Configuring a User Probe.”) Then, we are free to analyze and display our new performance parameter, wall clock using tools such as TeamQuest View:
Summary Points
- Probes are an unintrusive way to collect and analyze application performance data.
- Choose your “weapon” carefully (either a User probe or a Table probe).
- For most applications you’ll want to write a user probe.
- Remember the underlying data format model, time-Y pairs.
- Write a script that outputs your data to stdio.
- Set up your probe using the TeamQuest utility, etc/setup.
Following these steps should make it easy to construct a successful application probe.
Get started with a capacity management practice
Learn how to do capacity management and get to know the right tools for the job.
