Tech has had a tremendous impact on the way today’s businesses seek continued growth and improvement. No matter what business they are in, executives everywhere are investing in technology that improves their business processes, gets them ahead of the competition and widens their margins. Ultimately, the return on that investment is determined by how well technology supports a business’ ability to generate revenue.
Despite its importance to those at the highest levels of a company, the actual impact of technology is difficult to gauge. The pressures of digital business are forcing IT to cobble together infrastructure to meet heightened customer expectations, not necessarily in the most cost-efficient or effective way possible. As new technology is adopted at an accelerating rate, it becomes increasingly difficult to maintain operational visibility across IT infrastructure, let alone assess and report the value of that infrastructure to business stakeholders.
The Reasons for an IT Metrics Dashboard
It’s clear that a better strategy for measurement is needed across a rapidly evolving technical environment -- without it, organizations are simply flying blind. Business leaders are provided dashboards, briefings and reports in search of insights to help them find ways to improve business. Yet these tools generally fall short of providing a comprehensive picture of how technology impacts business in business terms; much less clearly indicate areas of focus needed to better drive performance through technology. An organized and comprehensive strategy for measurement has numerous benefits.
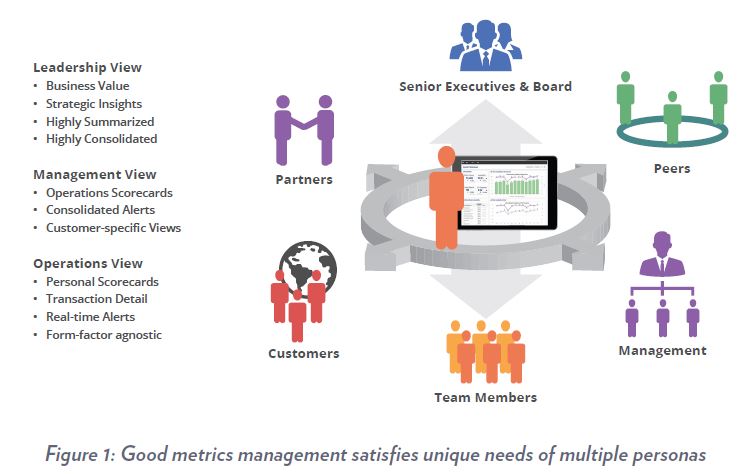
For the technical leadership, it means having accurate data to find the optimal level of investment in technology. It also means not having to constantly justify IT spend. For the business leadership, it means a clear view of how technology investment drives business.
For IT Management, it means having visibility into technical aspects of operations across organizational domains- resulting in harmonized operations, a more stable environment, and ultimately agility in the face of business demand.
An effective dashboard is one result of a well-executed metrics management strategy. A strategy is needed behind the dashboard since this is where some of the more difficult and often overlooked aspects of dashboard development are spelled out. The strategy should include solving the challenge of how dashboards stay current with business imperatives along with how well technology is working to support business. Bypassing the development of an organized strategy for metrics management usually results in dashboards that are short-lived, disjointed or ineffective. The strategy takes into account the specific needs of each persona or role in an organization, how they access information, what they view and how they navigate to obtain answers. Given the short attention span of its audience, business value dashboards should be designed to serve up the right information at the right time and in the right format. Often confused for analytics, reporting or business intelligence, the term ‘dashboard’ itself is suffering from too loose a definition. It should simply signify the view that simply provides a person with a particular role in business with effortless access to ‘answers’.
IT organizations are complicated machines made up of lots of moving parts and people. Just like the business it serves, IT has an organizational hierarchy with a ‘chief’ at the top. Layered like an onion, the most technical parts of IT tend to be buried deep within the organization and least visible to the business. Capacity Planning, for example, is an IT function usually within a group under Availability Management, under Infrastructure and Operations, which usually is under IT. How do you relate the work being done in Capacity Planning to the impact it has on business when it is operating deep within IT?
How do you showcase the value of the work to the chief when just like good risk management, if the job is done properly nothing happens? With so many forces competing for attention at the top of an IT organization, work in the background stays in the background unless a fire erupts. Now expand this scenario to a dozen disparate groups all doing very important and interrelated work within IT, each with their own tooling and ‘dashboards’. Picture what needs to happen when the leadership needs a current top view of IT performance via metrics and reports.
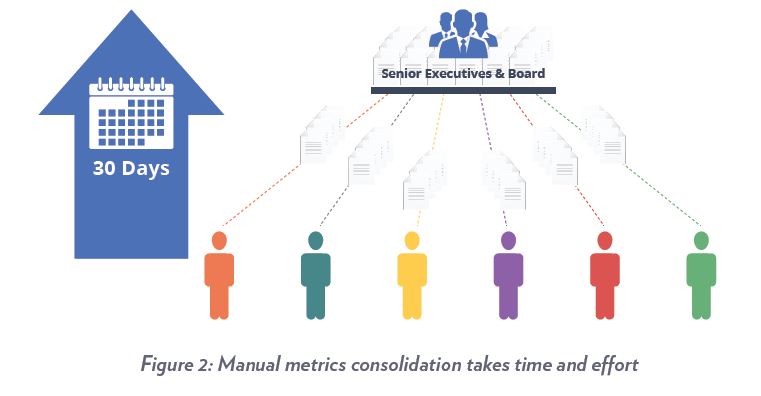
A hugely manual effort is needed to compile the information needed to answer most of the hard questions. Then it has to be done over and over again. Not only is the process of metrics consolidation manually intensive and error prone, what is typically produced is a report that is historical. After all that effort, what the leadership ends up with is a report that is the equivalent of using a rear-view mirror to drive a truck down a busy freeway. This is why a holistic strategy for the unification and management of important metrics (at the right-time!) is needed.
I&O Maturity and Metrics Management
IT’s ability to perform efficiently, avoid the risk of catastrophic events, and quickly react to changes is measured by its maturity. IT organizations that run at the low end of the maturity scale operate in a constant state of chaos. They use resources inefficiently, are detached from the business and are unable to account for how IT resources are being consumed. Those at the highest level of maturity, on the other hand, deliver service so efficiently that they become a value-add to the organization. Not surprisingly, most organizations rank fairly low in the maturity scale. This is a reflection of how difficult it is to ‘get ahead of the curve’ in order make improvements to IT or organizations within. Those that successfully manage to do so approach the challenge incrementally, and with support from the highest levels.
A metrics strategy should include how metrics can be dimensioned, transformed by merging individual metrics or through the application of formulas. This addresses the need to evolve metrics so they solve increasingly sophisticated measurement challenges as organizations mature. This is a key capability in ‘future-proofing’ a metrics strategy and is mandatory towards the ability to transform all that is technical into metrics that business stakeholders care about.
Prioritizing which aspects of IT to improve in the quest for higher levels of maturity is a complex task. Various groups that make up IT as well as the processes unique to each make it so any effort towards optimization requires well-thought planning and coordination. A leading IT research organization suggests that there are four management dimensions to focus on in the quest for escalating maturity namely People, Process, Technology and Resources. There are a number of unique attributes within each of these management dimensions, but interestingly, only one common attribute spans across all.
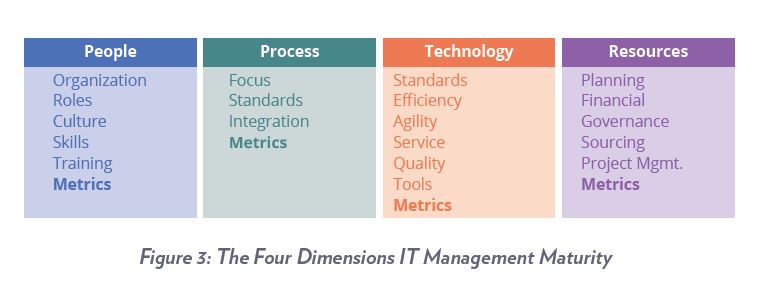
You guessed it, the attribute is metrics. This certainly makes for a compelling argument towards the development of a metrics management strategy to be the first order of the day in the effort to escalate IT maturity.
People Metrics
People represent IT’s most complicated and important resource. It is the IT leadership’s responsibility to ensure that people are in positions that best leverage their skills and that they are positively engaged. People metrics are normally gathered from HR, Learning Management Systems and other management tools outside of IT. It is when you put the metrics from these disparate systems together that the power of a measurement strategy shines. Metrics pertaining to skills, training, certification and employee engagement are those other than traditional people metrics that help with lining up people with jobs they are best suited to do. They also help map the development of skills towards goals of the organization. Investigate combining technical metrics with people metrics using the power of formula-based metrics. Often, unusual and valuable new insights can be gained by creative combinations, yielding useful, derived metrics that highlight compliance, safety, productivity and cost, among other perspectives.
Management initiatives such as ITIL and Six Sigma are often employed in IT to leverage best practices established by groups focused on best practice models. These organizations bring skill sets to the table as well as certification to ensure that people skills are up to the task. The same organizations offer best-practice metrics in each of their areas of focus. These metrics should be included in any metrics strategy since they serve to showcase benefits from the practice. From the leadership’s perspective, any investment that can be directly tied to overall organizational maturity (and benefits thereof) certainly deserves the attention.
Process Metrics
Every group in any established IT organization strives to operate within the guidelines of established processes. Process-related objectives include how quickly IT delivers applications, how defect-free application code is, ensuring maximum uptime, getting to the root of problems, and managing the expansion of IT infrastructure.
Performance objectives at the process level are generally supported by an established set of metrics. All too often these metrics are technical in nature and stay confined to each group supporting each process.
A metrics strategy should account for spanning across processes, floating interdependencies and bottlenecks through metrics. It should also account for transforming operations-level process metrics into metrics of interest to business stakeholders. For example, has the deployment of a web app resulted in the targeted revenue increase and at the cost projected? As a typical scenario, business demand drives the need for the deployment of more mobility-based applications. The deployment of these applications creates incidents which then start a Problem Management process.
This process then isolates the root cause of incidents which then is the start of a Change Management process. This initiates changes geared towards preventing the incidents that triggered the entire process to begin with. Meanwhile, other processes such as Availability and Capacity Management operate in the background to ensure that the infrastructure to support the business is in step with constantly evolving needs. Any exceptions generally result in Problem Management again precipitating required changes through Change Management.
Metrics within these processes tend to serve respective groups since each group has its own ‘finish line’ such as a defect rate, resolution time, SLA or OLA. The big-picture is neglected as every group stays focused on achieving its own commitments. Moreover, a lack of standards across tooling results in disparate measurement systems and non-standard metrics in individual processes. A metrics strategy should include how metrics are automatically derived from individual processes, rationalized, consolidated and transformed to indicate business-value. As well, the strategy should include the development of process compliance metrics, possibly the best indication of progress towards a higher level of organizational maturity. Ultimately, process performance can simply represented at a business level by what the impact might be to the business’ ability to generate revenue. One other representation to consider is what the impact might be to the customer and customer’s expectations.
Technology Metrics
Tools have evolved to where metrics are now available to measure virtually everything about any technology IT deploys. Since it is unlikely that there will be a singular, be-all technology in IT, the challenge is to figure how metrics are consolidated across platforms to provide an end-to-end view of how the platforms are working to deliver business services. In heterogeneous environments, it is good to adopt the use of a metrics catalog to resolve disparate metrics from disparate tools into a common standard. Aside from metrics pertaining to efficiency, agility and service quality, consideration should be given to metrics that might be the basis for a chargeback (or showback) scenario as well as metrics to help build an ROI story for diversity.
For example, an application server might have suffered an outage but because of diversity, related business services stayed available 100% of the time. From an infrastructure monitoring perspective, the metric of interest would be the server downtime. From an application monitoring perspective, the metrics of interest would be the availability of applications running on the server. The business-value metric of interest is the combination of both, showing the would-be outage in terms of how long business might have been impacted as well as the resulting revenue loss which was avoided through diversity (failover technology). Metrics like these help justify IT spend and help answer questions from business stakeholders about why IT is ‘expensive’.
Resource Metrics
Business stakeholders and IT leadership should have a clear and constant view of how efficiently IT resources are being allocated through metrics. Unfortunately, it is quite normal to find disparate systems serving this function in the front and back offices of IT, making this another manually intensive reporting task to gather metrics of interest for the leadership. Various groups that manage IT infrastructure for example, use disparate tools for network, security, VM, storage and server monitoring, each of course with its own reporting system and dashboards. IT resources include systems to service management processes such as incident, problem and change management. Other examples of back office systems include ERP, PPM, Financials, Project Management and Procurement. While these systems serve specialized functions, they tend to be cryptic and difficult to navigate for the occasional browser/user. For example, PPM systems manage project portfolios down to very specific details, making navigation through the system difficult for an untrained user.
Yet there are only a few key metrics needed from PPM to answer an IT or business stakeholder’s needs.
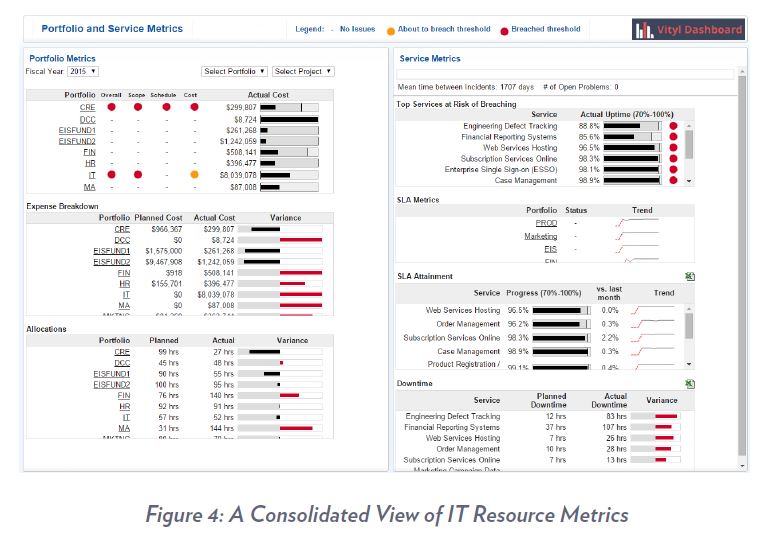
A strategy for end-to-end metrics should include how resource metrics are gathered from these disparate resource management systems, which metrics are gathered, how they are consolidated with other IT metrics and finally, how they are published. This speaks to the need for a catalog-based approach to metrics management.
The greatest advantage of a catalog-based approach is in being able to define an ideal set of metrics for each process, function and role, inside and outside of IT. This approach enables metrics to be consistent and interrelated, even as underlying systems come and go. Finally it allows metrics to stay in step with the business, evolving as needed.
The Business Value Dashboard
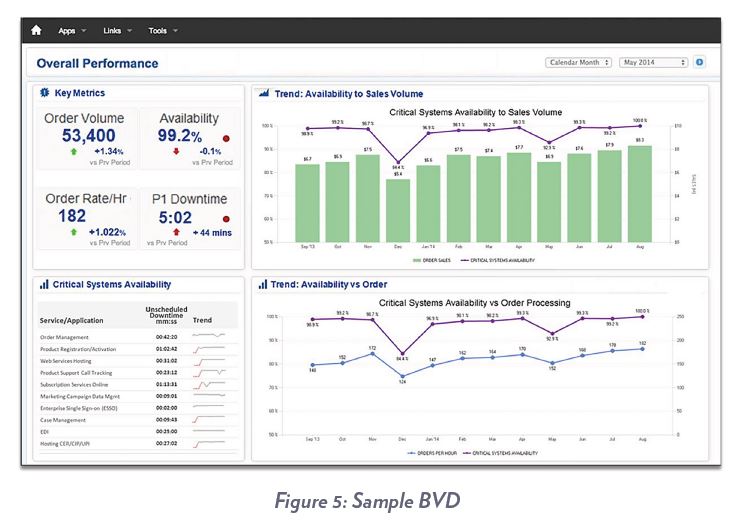
At the top of the dashboard food chain is the Business Value Dashboard (BVD). As its name implies, this dashboard is geared to showcase IT’s high level business value to IT executives (like a CIO dashboard), business leadership, and customers.
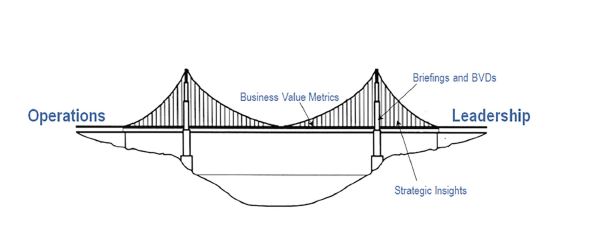
The biggest reporting challenge a Services Provider has is in providing its customers with a view of how they are doing as a provider of outsourced services in business terms. Since each customer contract generally has unique terms, their dashboards should be an embodiment of all the value they’ve agreed to deliver to each specific customer. This isn’t much different from what IT needs in serving as a provider of technology services to the enterprise. Maintaining a balance of usability, consistency and personalization in dashboards serving this environment is difficult at best. It takes well thought-out planning to deliver a BVD (i.e. also part of a metrics strategy). The catalog of business-value metrics has to be designed and aligned with what stakeholders need to see. Security considerations and corresponding role-based views need to be defined. Navigational paths and drill-downs as well as method of access need to be defined. Validation routines need to be established as any inconsistency with other reporting systems will erode confidence. It is a special high-value audience, the same one IT struggles to demonstrate its value to.
As for the key performance metrics themselves, it takes a few steps to get to a BVD as follows:
- Consolidation of operations-level metrics. This summarizes metrics from disparate systems into higher-order, net trend metrics.
- Consolidation of net trend metrics using business dimensions such as an organizational hierarchy or list of Cost Centers. This is one way operations activity metrics can be rolled up by Line of Business or cost center.
- Merging of core business metrics such as number of banking transactions or website orders with summarized net trend metrics.
Get to Know ‘The Line’
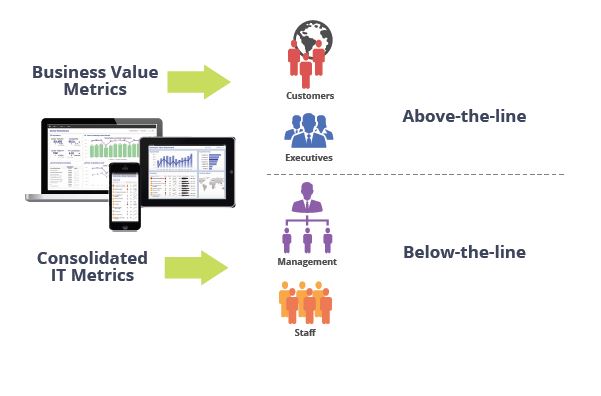
BVDs are made up of ‘above-the-line’ metrics. These are metrics that are not technical in nature, have business context and generally relate to business revenue and cost. Above-the-line metrics can target the needs IT leadership as well, which in this case, relate to IT’s share of revenue and cost.
Publishing Metrics to the Leadership
There are just a handful of rules to consider when publishing abovethe- line metrics and dashboards to an executive audience. These rules assure the audience gets the most bang for the buck in that every metric is as impactful, insightful and actionable as possible.
-
Transparency: Due to the segmentation of IT today, executives don’t get to see how various groups interact with each other to ensure optimal process. They also don’t get to see how investment yields overall results. IT leadership generally strives for top-to-bottom organizational transparency. The question to ask is if the metrics help to accomplish this.
-
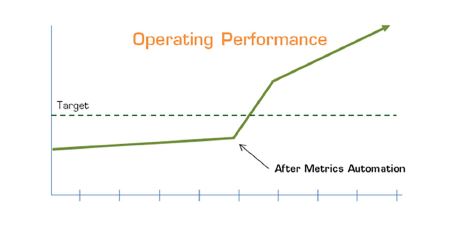
Automation: Wherever possible, automation should be leveraged to reduce or eliminate manual intervention in the gathering of metrics. Automation results in huge gains in metrics ‘freshness’ i.e. in the time that it takes to get above-the-line metrics to its executive audience. Near real-time metrics are proven to be invaluable in giving executives the ability to positively alter outcomes, a benefit that is impossible with the latency associated with manually assembled reports. Automation also builds trust and confidence in the audience learning to rely on BVDs. This audience best knows its metrics and automation helps ensure consistency and accuracy.
In general, any metric for an audience internal to IT is a ‘below-theline’ metric. A BVD represents the highest level of sophistication in IT metrics and reporting- the work that goes into producing it happens to be the same work in helping bring IT maturity upwards to the highest levels.
- Context: It is important to ensure that the appropriate context is built around a metric to answer the question of “so what?” The most valuable nuggets of brilliance executives look for are buried in combinations of metrics and context. Context can be a historical perspective (i.e. compared to last month), a reference to another metric, a standard, goal, target or even a benchmark.
- Clarity: Is it clear what the metric is, why it is important, who it is for, who owns it, what is bad, what is a good/bad indication, what impact it might have and how the metric was put together to begin with? Answers to these questions are usually compiled when BVDs are being designed. In considering how the metrics are published, ensure that these questions are answered and do not leave the audience guessing even if means using tooltips or a mouseovers that expose the answers on demand.
- Never Done: Metrics are always evolving, as is the business IT serves. BVDs should be in a constant state of improvement using a feedback mechanism users can use to provide input on refinements to how metrics are obtained and used.
Conclusion
Given the wide variety of measurement challenges found in IT, not many have taken a step back to assess the big picture and formulate an end-to-end strategy for metrics. Instead, the easy route is to find a dashboard tool, sometimes the incumbent enterprise ‘standard’, to fit each localized need. When the tool is force-fit to a specialized set of needs, the results are predictable- the dashboards at some point cease to be useful. There are dashboard tools that focus on data visualization, business intelligence, analytics, big data and just about every way you’d like to see data represented in a graphical view. While great for representing just about anything, many tools require data to be formatted a certain way, leaving out the heavy lifting needed in automated data gathering, transformation and formatting. There are tools that leverage in-memory analytics to deliver blindingly fast cubing and pivoting. While great for users who are into complex ‘what-if’ scenarios, 97% of people in IT generally just need answers and find the UI in these tools too complicated. There is a balance between the complexity of a user interface, consistency, usability and personalization. Ideally, a tool serving the needs of an end-toend metrics strategy should have the ability to tailor this balance as needed.
The following is summary of functions to investigate when considering a tool to use behind a strategy for metrics management:
- Automated collection and consolidation – Technical connectors and pre-built integration with systems, applications and data sources, cloud-based and on-premises. Ideally the tool should be able to ingest, process and publish data in near-real time.
- Metrics history – A cache such that historical perspectives and references to previous time periods can be called as needed from metrics applications.
- Metrics Catalog – A system-of-record to store and manage every metrics attribute, dimension, formula and history of change.
- Formula-based Metrics: How derived metrics might be created from existing metrics with the use of metrics formulas. Transforming technical metrics into business-value metrics for example, requires the ability to apply business denominators to technical metrics to obtain higher-order, business value metrics. A simple example is taking the number of application servers (technical metric), dividing that by the number of credit card transactions (business metric) to obtain the derived, formula-based metric.
- Dimensioning – The ability to ingest business dimensions such as locations, organizations, regions, products, offerings, cost centers, etc. These serve as ways metrics can be summarized in groupings that are relevant to each type of persona or user.
- Security/Authentication – Role based management of views ensure that metrics can be partitioned to match what a role member can see and navigate/drill-down to. Ideally, integration with external sources of authentication such as ActiveDirectory or LDAP simplifies role-based access. This also satisfies single sign-on capability.
- Visualization – The ability to present data in various visual graphical formats
- Presentation – The ability to make views accessible via any known technology such as browsers, mobile devices, portal technologies, video walls, readerboards and LCD monitors.
Ready to begin?
Create effective, professional dashboards to deliver to your stakeholders with the help of qualified consultants.