Better Network Insights—Together
Take advantage of Intermapper's network performance monitoring right within Splunk's interface—for faster, deeper analysis
If you’re using Splunk Enterprise to analyze big data on your IT systems, you can make that data even more actionable by integrating Splunk with Intermapper. While network monitoring and log analysis features have traditionally been provided by individual machines, you can now combine the power of Intermapper and Splunk in one spot for improved issue resolution.
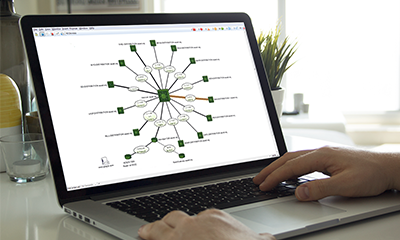
Intermapper creates a live map of your network devices and notifies you immediately when issues occur. If you're using both Intermapper and Splunk, our free add-on application allows you to create an Intermapper dashboard right within the Splunk interface to provide you with real-time information about devices statuses. Because you never have to leave the Splunk interface, it's easier than ever to both identify and analyze concerning network events as soon as they occur.
Why Use Intermapper and Splunk Enterprise Together?
One Spot for Network Performance Analysis
Using the Intermapper App for Splunk, you see all of your critical metrics directly within Splunk, including Intermapper map data and notifications for one comprehensive view of your network performance.
Maximize the Value of Machine Data
Splunk Enterprise is a syslog analyzer that helps network administrators collect and analyze machine data across their IT infrastructure. With the added functionality of the Intermapper App for Splunk, you can get real-time network metrics and receive Intermapper alerts directly within Splunk to make all your data even more actionable.
Diagnose Device Issues
Having real-time monitoring data from your Intermapper maps available in the Splunk interface gives network administrators a greater understanding of the root cause of device issues so they can be resolved more quickly.
Key Features
Data correlation between Intermapper and Splunk

The Intermapper App for Splunk Enterprise brings Intermapper’s device metrics and notifications into the Splunk software for analysis alongside syslog messages and log files. Together, the data provides an end-to-end view of a machine’s status.
Live network maps and monitoring

Monitor and map network hardware, software, and bandwidth in real time right within the Splunk interface. See live Intermapper maps and drill in for deeper performance metrics.
Single interface

Two essential network diagnostic tools combine in one with the Intermapper App for Splunk Enterprise. Within Splunk’s dynamically generated dashboards, see Intermapper maps and log data all in one location.
Enhance Splunk for Even Deeper Monitoring
Get Started with Intermapper
Want to monitor more devices? Try Intermapper with Splunk when you download our free trial. You can monitor up to 500 network devices for 30 days.
Find answers to device issues more quickly and easily with the Intermapper App for Splunk Enterprise. Try the app when you download our free 5-device version.