Intermapper is industrial-strength network mapping and monitoring software that supports Linux, Windows, and Mac platforms. Learn more about the mapping, monitoring, and alerting features Intermapper provides in this detailed overview.
System Requirements
Intermapper, Intermapper Flows, and Intermapper Remote Access run on Windows, Mac OS X, and Linux. To run Intermapper Flows, Fortra recommends a computer with high processor power and a large amount of RAM for its database cache.
For Intermapper Remote Access, a full, paid copy with a distinct serial number allows one connection to the system. Multiple connections require multiple copies. See Intermapper's full system requirements here.
Summary

Intermapper enables full visibility and monitoring of the IT environment through real-time visual representations of network topology, server and device performance monitoring, and highly configurable alerting mechanisms.
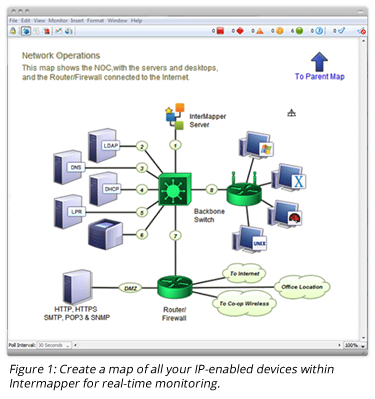
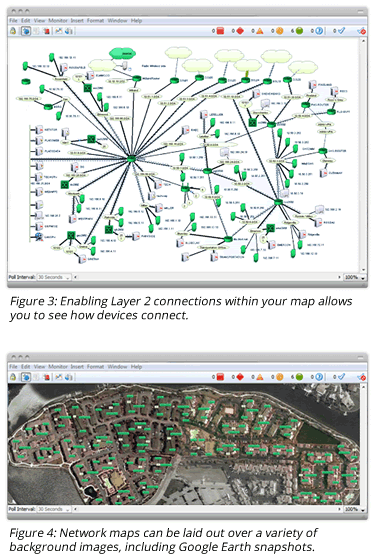
Through an autodiscovery process, the Intermapper server assimilates a visual representation of all IP-enabled devices within a network such as routers, switches, workstations, PCs, and laptops. These network devices are polled at timed intervals using SNMP and other network protocols. Data from these devices is retrieved, stored, and displayed on a map. Layer 2 connections can be displayed on the map to show physical links between devices and accelerate troubleshooting for devices in warning or critical states.
Along with Intermapper, two supporting products add additional functionality and visibility into network traffic.
Intermapper Remote Access is a GUI application configured on a user’s PC, Mac, or Linux System to allow visual access to network maps from a remote computer. Through IMRA, network administrators can see maps, chart data, and settings. Users can configure and edit these maps regardless of their location.
Customizable alerts can be set to inform network professionals who are not actively monitoring the console when thresholds are exceeded or devices are up or down, depending on user-configured data ranges being monitored. These notifications ensure network issues are not missed.
Flows-capable devices are configured to send data to Intermapper Flows. Intermapper Flows examines this data in order to display top talkers and listeners, protocols, and conversations. Flows-based monitoring enhances a network administrator’s ability to identify the source of traffic peaks and drill down into more detailed session information.
While Intermapper Remote Access is a separate installation, Intermapper Flows is installed along with Intermapper.
Architecture
As the software does not rely on agents installed on devices, Intermapper communicates with and supports IP-enabled devices on your network.
The software has a built-in polling engine that allows for continuous data capture from monitored devices. Probes—software plug-ins that use vendor-specific identifiers—capture data from devices and display it on a map.
Intermapper uses a built-in database and HTTP server, both of which are installed along with the base application. No additional database maintenance or installations are required.
Security
Authentication Configuration
Intermapper allows you to control access to your server by requiring a user name and password from all users. You can configure Intermapper’s built-in firewall to accept or deny connections from a client based on its IP address.
Intermapper’s server can also authenticate users against external directories such as LDAP/Active Directory, RADIUS, and Kerberos. This is done through Intermapper’s authentication server, which is provided with the product’s base installation of Intermapper Data Center.
Roles

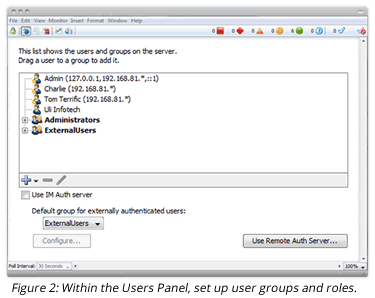
Role-based security ensures that users only have access to product functions they need to perform their tasks. This security setup eases maintenance as changes can be made to the role level that will apply across all users assigned to that role.
The product is shipped with admin as the default user and administrator as the default role. Simple drag-and-drop functionality from the Users Panel allows administrators to place users in specific roles. From the Users panel, add and edit users and groups, assign users to groups, and assign privileges and access to maps.
For larger organizations with multiple maps, access and editing capabilities can be given to users on a map-by-map basis, including view, change, online access, and remote access.
Probes
Probes define how to retrieve and display data from particular devices. Intermapper uses probes to gather and retrieve data that network administrators want to monitor for specific network devices. Using SNMP, TCP, and HTTP network protocols, data is retrieved and fed back into display within the Intermapper software, where it can be viewed and analyzed.
Intermapper contains 100s of probes built-in to the software including SNMP, SNMP trap, TCP, command-line, and big brother probes. Users can also easily modify the existing probe files to produce new probes that will test additional aspects of device operation. Probe files are simple text files that can be modified with any standard text editing utility.
User-contributed probes are available on the Intermapper website and free for the Intermapper community to download and use.
Mapping

Within Intermapper, network maps can be created in three different ways: by entering IP addresses manually, importing a file, autodiscovery, or flows data. Through the autodiscovery process, all IP-enabled devices within a network can be automatically assembled on a map. Layer 2 connections can be added to depict digital connections between devices and assist in understanding how the failure of one device is impacting the rest of your network. You can also schedule regular auto-discovery at scheduled times in order to keep your map up-to-date. Scheduled device detection finds any new devices on your network, displays them in a separate DetectionMap, and can even send you an immediate alert when new devices are discovered. Based on what kind of devices you’re interested in detecting, you can also specify a specific IP address range or subnet to scan. Any new devices Intermapper finds that you want to continuously monitor can be dragged to an active map.
Use Intermapper’s layout tools to cluster related items and move them to different parts of the map.
Through new device detection with Intermapper Flows, any Intermapper user can capture network devices using the Intermapper server—no separate Intermapper Flows license required. Using this method, you can detect all internal and external devices that are connecting to the network. In the same way, any newly-found device will show up in the DetectionMap, notifiers can be configured to alert the operator that a new device has been found, and the operator can move the device to an active map if desired.
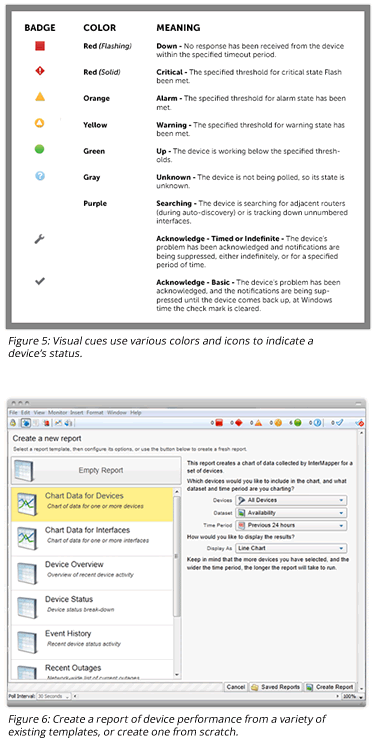
Maps can be configured in a wide variety of ways to reflect user preferences. Use the Map Settings window to customize map colors or choose a background image. To easily show the physical location of your devices, overlay devices on an office floorplan or Google Maps display. Devices are shown as rectangles by default; choose from a wide variety of icons to further customize map layout, or upload your own. Plus, users can export maps to Microsoft Visio and .SVG format.
Users can also create top-level maps that overview individual sub-maps within. Sub-maps will indicate the most serious condition on its sub-map by its color indicated on the top-level map.
Monitoring

Once the network map has been set up, users will see all devices that have been added to their map and their current status of all devices and interfaces indicated by visual cues.
From the map screen in the Intermapper console, network administrators can click to view a Status Window indicating real-time metrics about any item on a map (a device, a network, or a link) such as packet loss, response time, or bandwidth utilization. Interface windows show a compilation of metrics for all the interfaces on a device, including their availability. Create strip charts of important metrics to see their performance over time.
Intermapper is set to poll your devices every 30 seconds by default, but poll intervals can be edited for individual devices or map-wide to monitor devices on a specified interval.
Alerting/Notifications
When network professionals are away from their desks, they can receive customized alerts about network performance—such as up-down status or bandwidth issues. Alerts can be set up at the device or interface level to notify individuals via SMS text, email, sound, pager, or by running a program to correct the problem. In the case of an alert not being answered, multiple alerts can be applied as an escalation method.
Intermapper notifications can be deeply customized to include information that will most assist administrators in troubleshooting problems. Messages may include, for example, the time the event occurred, the IP address of the device, and/or the status of the device.
Third-party alerting tools with a web API may also be integrated with Intermapper.
Analytics/Reporting
Users can overlay strip charts right within their map to simultaneously monitor network performance as they drill into specific metrics. Strip charts can be created by clicking on any numerical value to display a line chart of performance over time.
Additionally, Intermapper Data Center utilizes a built-in database on the Intermapper server for historic charting and reporting on collected data. The database can be queried using standard SQL queries.
Remote Management
Using Intermapper Remote Access, users can configure and edit maps on an Intermapper installation from a remote computer. Dynamic data displays replace static browser windows, negating the need to continually refresh for updates.
To allow these changes, the remote server accepts connections from Intermapper Remote Access client—a separate software package that can be installed on a different computer to be used to manage your Intermapper server installation.
Intermapper Remote Access can connect to multiple copies of Intermapper simultaneously, making it an ideal choice for organizations with multi-location sites, consultants who monitor client sites, and managed service providers.
Flows-based Monitoring
While Intermapper interrogates devices to determine their status, Intermapper Flows provides deeper insight into the traffic both received by and moving across your network. Integrated directly into the product, Intermapper Flows is integrated network traffic monitoring software which enhances your ability to analyze and record the data provided by your flows-capable devices, identify heavy traffic, and show traffic peaks.
Intermapper Flows works with NetFlow, sFlow, JFlow, and cFlow, and can identify the following:
- Top talkers and listeners
- Top protocols in use
- Top conversations and sessions
- Detailed session information to identify particular machines
Open the Flows window to view data over a specified period, view current Host, Port or VLAN data in a stacked area chart (or as a percentage of total data flow in a pie chart), or view details about a specific host, port, or VLAN. By clicking the refresh button, your current view of Flows data will be automatically updated.
Autodiscovery
Autodiscovery uses heuristic techniques (including SNMP probes, ICMP echo packets, and DNS and NBP queries) to scan your network and locate all devices present within the network.
During the autodiscovery process, a Discovery Status bar will appear to show progress statistics, including how many subnets and queued routers have been identified, and how many addresses are remaining to be reviewed.
During autodiscovery devices show up on a visual map. Maps can be configured based on user preferences. Show a simple listing of devices, or turn on Layer 2 features to show connections between devices.
Integrations
Automate
Intermapper seamlessly interfaces with Automate, business process automation software from Fortra that automates a wide variety of business applications and technologies in order to simplify daily processes. The interface allows anyone using both Automate and Intermapper to set up predefined scripts to run in response to alerts, as well as perform automated actions within the system such as moving or rotating log files, or running safer Intermapper backups.
To configure actions in response to alerts, such as when a service has failed, users first set up an action within Automate to run on a specified device. Once this action is configured, users can set up a notifier within InterMapper that will trigger the predefined action in Automate.
In order to utilize the function, three conditions must be met: Automate and Intermapper must be running on the same server, both solutions must be deployed on Windows, and users must be running Automate 10 or later. Those who are running Intermapper on Linux or Mac OS will have to move InterMapper to the Windows platform in order to utilize this function.
Splunk Enterprise
Network professionals who use Splunk Enterprise and Intermapper can take advantage of both products’ capabilities within the free Intermapper App for Splunk Enterprise.
Simply log into Splunk and access your Intermapper maps within the Splunk interface. See all of your device statuses and connections within the map in real-time. Drill into specific devices or alerts to view log information about the event. Easily customize the timeline to see syslog messages and log files for a particular time period.
AWS Monitoring
Intermapper can hook into AWS, allowing you to extract performance monitoring data from that platform and import it into the Intermapper software. All you have to do is add your EC2 instances to Intermapper and you can begin tracking key performance metrics from there.
Application Interfaces
Intermapper Web Server
Intermapper also offers its own mobile-friendly web-based interface which users can access securely via phone, tablet, or web browser. The Intermapper web UI sizes appropriately to fit whatever device you are using.
Within the web UI, you can view all of your Intermapper maps, charts, and device information. As browser-based access is intended to serve monitoring purposes, the web UI is not a fully manageable solution. New maps must be created within the Intermapper client.
Learn More
Find upcoming webinars and a variety of educational articles, guides, and videos on our Resources & Events page.
Ready to get started?
Try Intermapper free for 30 days and see what you think. Learn more about the different software plans we offer, from subscription to unlimited monitoring, on our pricing page.